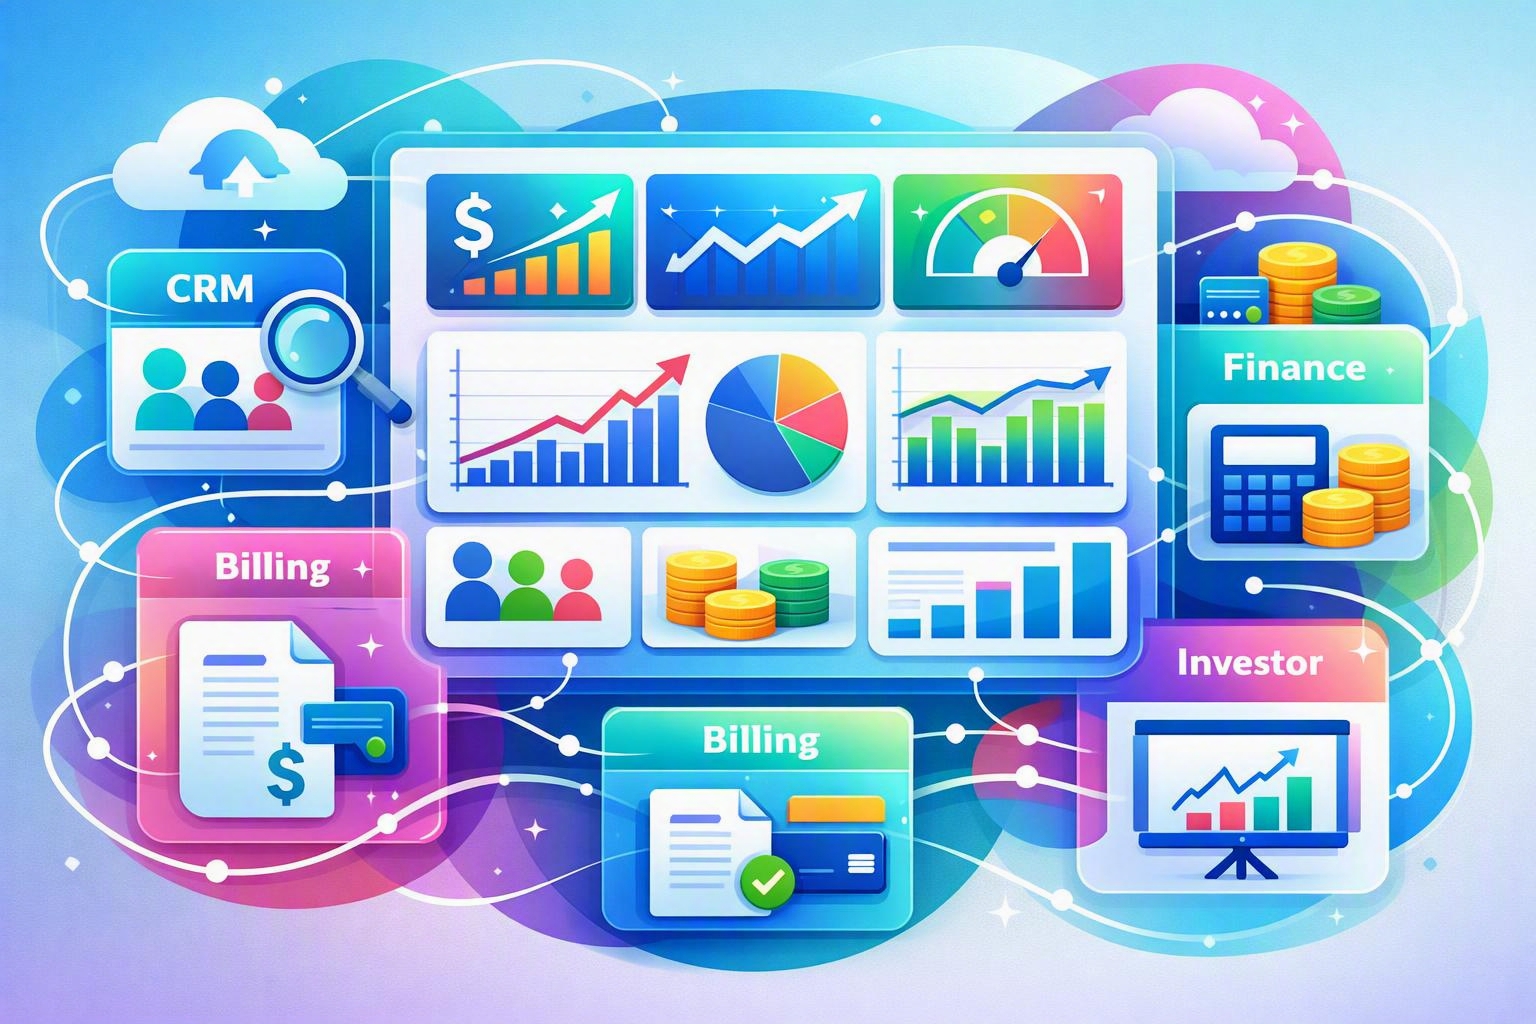
Creating a SaaS investor dashboard is not about building the most visually impressive analytics interface. Investors care far more about consistency, clarity, and whether the underlying numbers can be trusted over time. The best dashboards answer critical questions quickly, including cash runway, recurring revenue growth, customer retention, and growth efficiency.
For many SaaS founders, investor reporting becomes a monthly scramble across spreadsheets, billing exports, CRM data, and accounting systems. A strong reporting framework changes that process entirely by automating data collection and standardizing how metrics are presented. This guide explains which metrics matter most, how to structure a dashboard investors will actually use, and how platforms such as MainFoundry can help automate reporting using connected CRM and finance data.
What Investors Actually Want to See in a SaaS Dashboard
The most effective investor dashboards follow the same structure every month. Consistency allows investors to recognize patterns immediately instead of relearning the reporting format each time. Your dashboard should focus on a few core business fundamentals, including cash health, recurring revenue performance, retention, growth efficiency, and a concise operational narrative.
Cash position should appear first because it is usually the first metric investors review. Display current cash balance, average monthly burn, and estimated runway prominently at the top of the dashboard. However, these numbers become much more meaningful when paired with six- or twelve-month trend lines that show whether burn is stabilizing or accelerating.
“A dashboard becomes valuable when investors can identify business trends in seconds instead of searching through disconnected reports.”
The next section should focus on recurring revenue, which effectively acts as the health score of a SaaS company. Monthly recurring revenue, annual recurring revenue, and net new recurring revenue should all be visible alongside comparisons to prior months and budget targets. A compact KPI table often works well because it allows investors to spot variances immediately.
Net new revenue deserves special attention because it explains how growth is happening. Separating new revenue, expansion revenue, contraction, and churn creates transparency around growth quality. Investors watch expansion revenue closely because increasing account expansion often signals strong product adoption and healthy customer relationships.
Retention trends often reveal long-term SaaS health more accurately than short-term revenue growth.
Retention metrics should remain focused rather than overloaded with charts. Net revenue retention, gross revenue retention, logo churn, and revenue churn are typically enough for the primary investor view. Deeper cohort analysis can live in supporting tabs or board-level drill-down reports. This keeps the main dashboard readable while still supporting detailed due diligence discussions when needed.
Growth efficiency metrics connect sales operations directly to financial performance. Pipeline value, qualified opportunities, customer acquisition cost, lifetime value, and payback period all help investors evaluate whether growth is economically sustainable. Teams using the MainFoundry CRM platform can centralize deal stages, pipeline activity, and customer records inside the same operational system, reducing reporting gaps caused by disconnected sales and finance tools.
Most investor dashboards also benefit from a concise narrative section that explains major wins, challenges, and upcoming priorities. Metrics alone rarely tell the complete story. Investors generally want context around operational changes, missed targets, and specific areas where they may be able to help.
- Two or three measurable wins from the reporting period
- One or two challenges or missed targets requiring attention
- Upcoming priorities and a clear investor request or introduction ask
How to Automate Reporting With Connected CRM and Finance Data
Manual investor reporting creates inconsistencies and eventually erodes confidence in the numbers. The most reliable dashboards pull directly from centralized operational systems where finance, billing, CRM, and marketing data connect to the same customer records. When metric definitions remain stable every month, investors spend less time validating data and more time evaluating business performance.
Unified operational platforms simplify this process significantly. MainFoundry combines CRM records, finance operations, billing workflows, marketing attribution, and custom operational systems inside a shared environment. Instead of stitching together exports manually, companies can build reporting directly from synchronized customer and financial data.
Pro Tip: Lock investor-facing reports to month-end snapshots even if operational dashboards refresh continuously. This prevents numbers from shifting after updates have already been shared with investors.
For example, recurring revenue metrics can be generated automatically from subscription records inside a connected finance and billing management system. CRM opportunities can simultaneously populate bookings and pipeline metrics without requiring separate spreadsheet reconciliation.
Automation works best when the underlying data models are standardized. Subscription records should track recurring revenue values, contract periods, churn status, expansions, and downgrades consistently. CRM opportunities should classify deals clearly as new business, renewals, or expansions so calculations remain repeatable over time.
Retention calculations become much more accurate when customer-level historical tracking exists. Many SaaS companies use a customer-month revenue table because it allows direct comparisons between beginning and ending recurring revenue across cohorts. Similarly, linking accounting data with CRM systems improves customer acquisition cost calculations by aligning marketing spend with closed-won customer counts.
Presentation also matters more than many founders expect. Investors generally prefer clean layouts with top-level KPI cards, concise comparison tables, and a few supporting trend charts instead of overloaded analytics screens. More detailed reporting, including churn segmentation or cohort analysis, can live in secondary drill-down tabs.
Teams using custom workspaces can maintain separate operational and investor-facing views without duplicating systems. Additionally, AI-assisted reporting tools are increasingly useful for summarizing metric changes and generating recurring narrative updates automatically. MainFoundry’s AI platform tools help streamline reporting workflows using live CRM and finance data as context.
Over time, historical consistency becomes one of the dashboard’s greatest strengths. Investors can quickly identify whether retention is improving, growth efficiency is weakening, or cash burn is stabilizing because the underlying structure remains familiar quarter after quarter.
Key Takeaways
A strong SaaS investor dashboard focuses on trust and clarity rather than visual complexity. Investors want fast visibility into cash position, recurring revenue growth, retention quality, and operational efficiency. Consistent formatting and stable metric definitions are often more important than adding additional charts.
Automation plays a major role in maintaining reporting accuracy. When CRM activity, billing systems, finance operations, and customer records live inside connected workflows, investor reporting becomes a natural extension of daily operations instead of a separate monthly project.
If you are building a dashboard from scratch, start with a focused KPI structure, automate data collection early, and maintain a predictable monthly reporting cadence. As your reporting matures, you can expand into cohort analysis, forecasting, and deeper board-level reporting.
To explore how unified CRM and finance workflows can support investor reporting, visit MainFoundry or contact the team directly at https://www.mainfoundry.com/contact.
Related Reading
Learn more about improving operational visibility with the MainFoundry CRM platform and connected finance workflows.