Et stærkt customer success program er blevet afgørende for moderne SaaS-virksomheder, fordi churn, produktadoption og expansion revenue i stigende grad afhænger af, hvor tidligt teams opdager risikosignaler. Mange virksomheder har allerede adgang til værdifulde kundedata, men når information ligger spredt mellem CRM, support, økonomi og produktanalyse, bliver opfølgningen ofte reaktiv i stedet for strategisk.
I denne guide gennemgår vi, hvordan du opbygger et operationelt customer success setup med sundhedsscorer, playbooks og proaktive workflows baseret på faktiske kundesignaler. Du får konkrete eksempler på, hvordan danske SaaS-teams kan samle kundedata, reducere churn og skabe mere forudsigelig retention uden at starte med komplekse modeller eller tunge processer.
Hvordan et customer success program bliver operationelt
Det første skridt er at definere, hvad customer success skal understøtte i virksomheden. For nogle SaaS-teams handler det primært om lavere churn, mens andre fokuserer på onboarding, højere produktadoption eller mere expansion revenue. Uanset målet bør customer success være tæt koblet til konkrete forretningsmål fremfor at fungere som en isoleret supportfunktion.
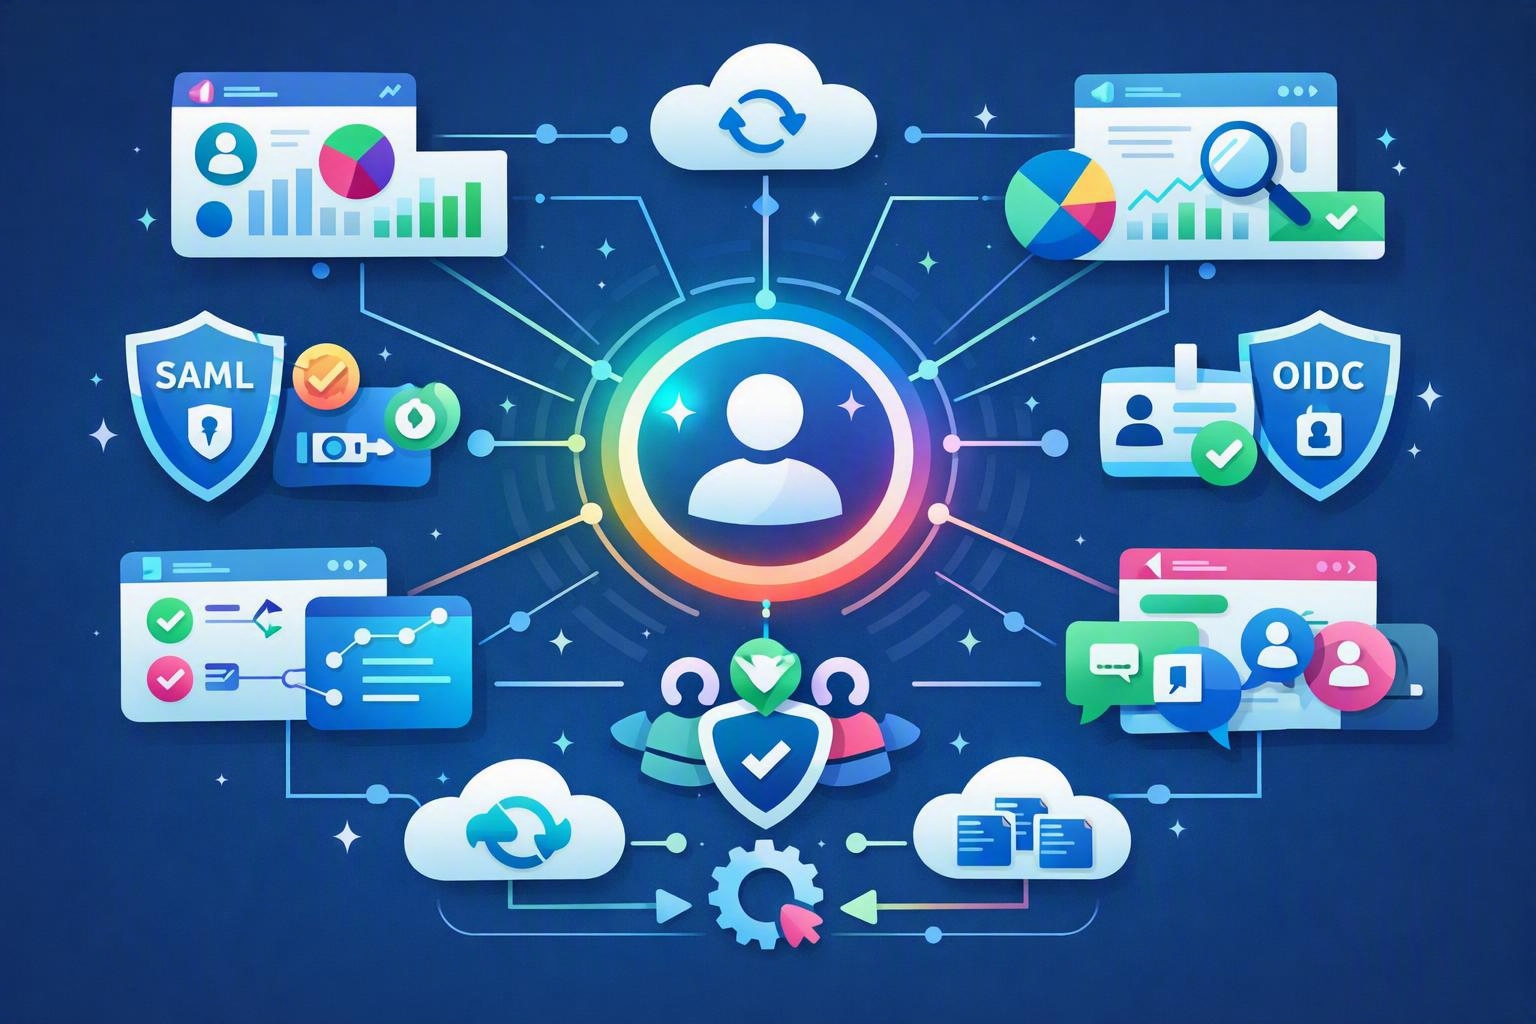
Mange virksomheder arbejder stadig med forskellige kundebilleder internt. Salg ser kontrakter og pipeline, support ser tickets, finance overvåger betalinger, og marketing følger engagement. Et effektivt customer success setup opstår først, når disse signaler forbindes i én samlet kundetidslinje. Derfor vælger mange virksomheder at samle data i løsninger som CRM og kontaktstyring, hvor aktivitet, abonnementsdata og kommunikation hænger sammen.
“En konto virker sjældent risikofyldt ud fra ét signal alene. Det er kombinationen af faldende produktbrug, betalingsfriktion og lavt engagement, der afslører churn-risiko tidligt.”
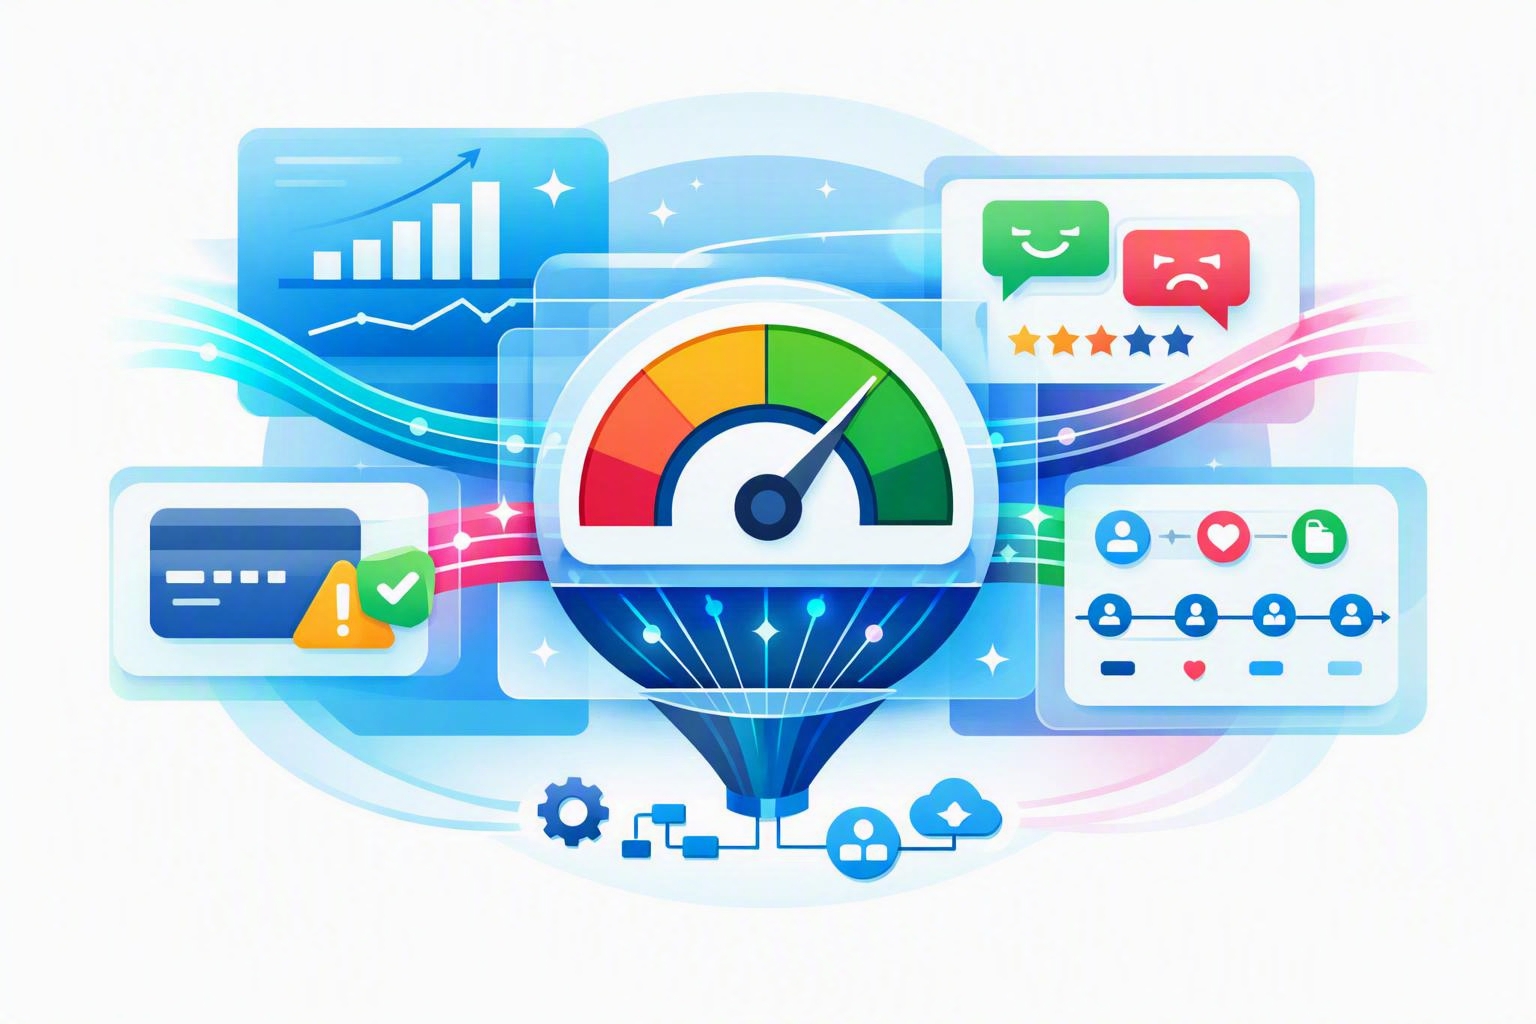
Når datagrundlaget er samlet, bliver næste trin at etablere en sundhedsscore. Mange virksomheder forsøger at bygge avancerede predictive modeller fra begyndelsen, men de mest effektive løsninger starter ofte simpelt. Produktbrug, supporthistorik, betalingsstatus og engagement giver allerede stærke indikatorer på retention eller churn-risiko.
Kvalitative signaler spiller også en vigtig rolle. Hvis en Customer Success Manager registrerer frustration omkring onboarding eller gentagne problemer i møder, bør det påvirke kundens samlede vurdering. En sundhedsscore handler derfor ikke kun om analytics, men om at afspejle den faktiske kundesituation på tværs af hele relationen.
Pro Tip: Start med få nøglesignaler og tydelige tærskler fremfor komplekse modeller. En enkel sundhedsscore med klare workflows skaber ofte mere værdi end avancerede systemer, som teams ikke stoler på internt.
Selve scoringen er kun værdifuld, hvis den kobles til konkrete handlinger. Grønne konti bør stadig have faste touchpoints og renewal-forberedelse, mens gule konti kræver tidlig analyse af engagement og produktbrug. Røde konti bør eskaleres med tydelig handlingsplan, ledelsesinvolvering eller teknisk review, så opfølgning bliver konsekvent og ikke afhænger af individuelle vurderinger.
Brug data til proaktiv support og lavere churn
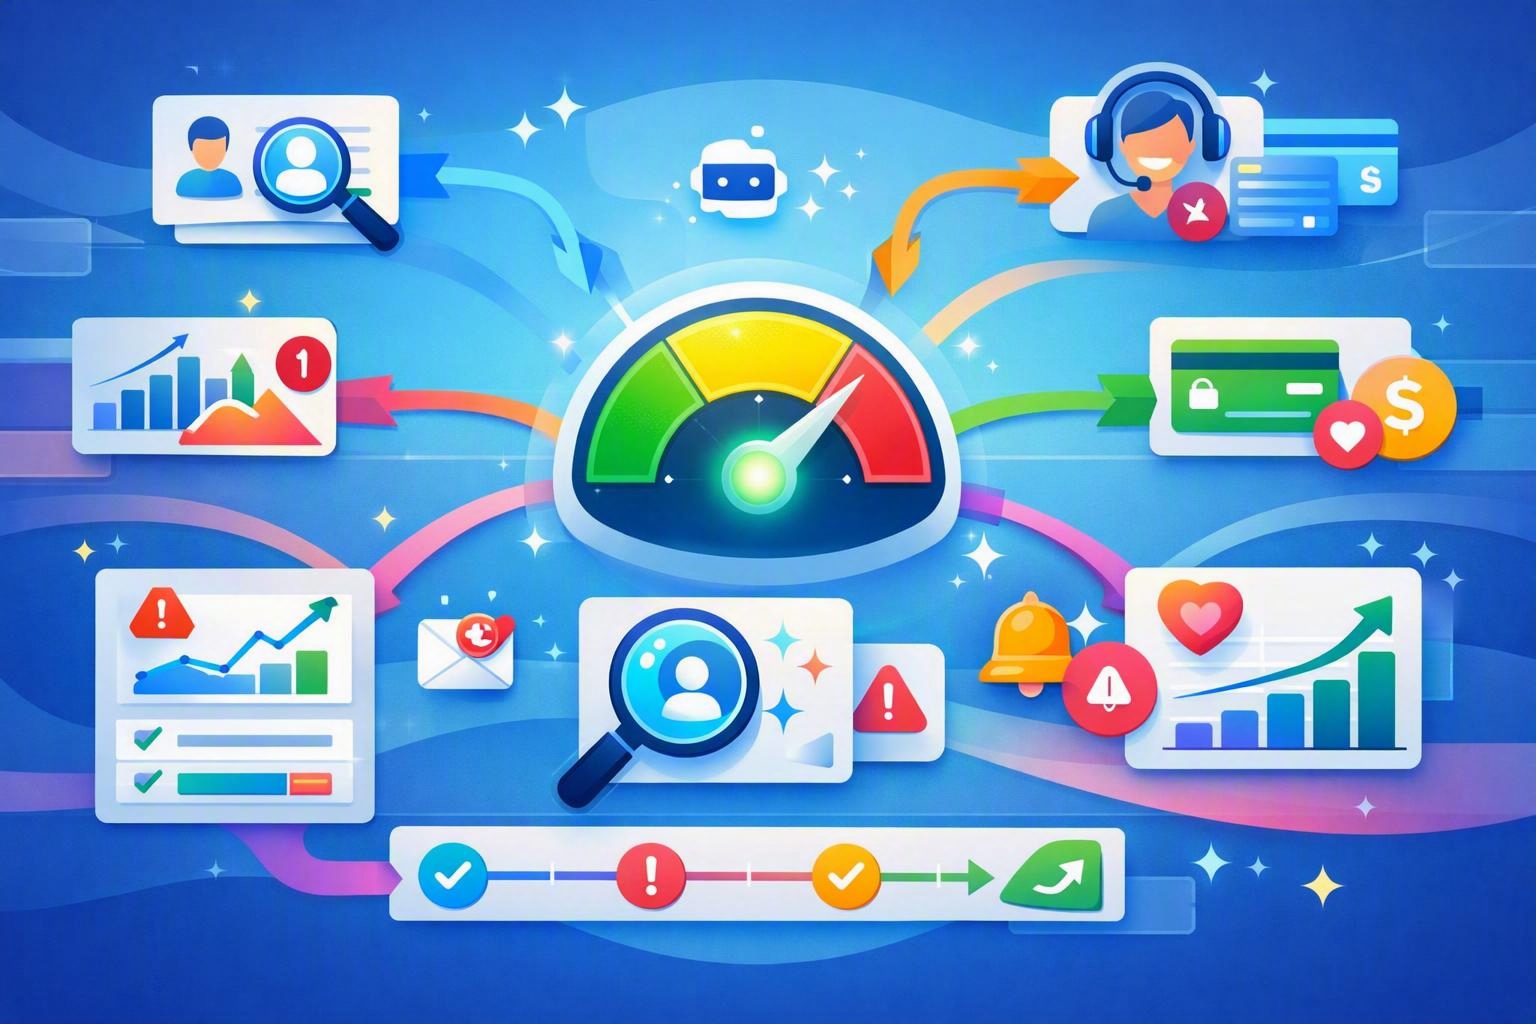
Proaktiv kundesupport handler om at reagere på signaler, før kunden selv eskalerer problemerne. Faldende produktbrug er et klassisk faresignal, særligt hvis aktive brugere falder over flere uger, centrale funktioner ikke længere anvendes, eller kunden reducerer licensforbruget. Når disse ændringer registreres automatisk, kan customer success reagere tidligt i stedet for først ved opsigelsen.
Supportdata er lige så vigtige som produktdata. Mange churn-forløb starter med små frustrationspunkter, som aldrig bliver behandlet strategisk. Hvis en kunde gentagne gange rapporterer de samme fejl eller har åbne sager over længere tid, bør det registreres som en reel risikofaktor og ikke kun som almindelig supporthistorik.
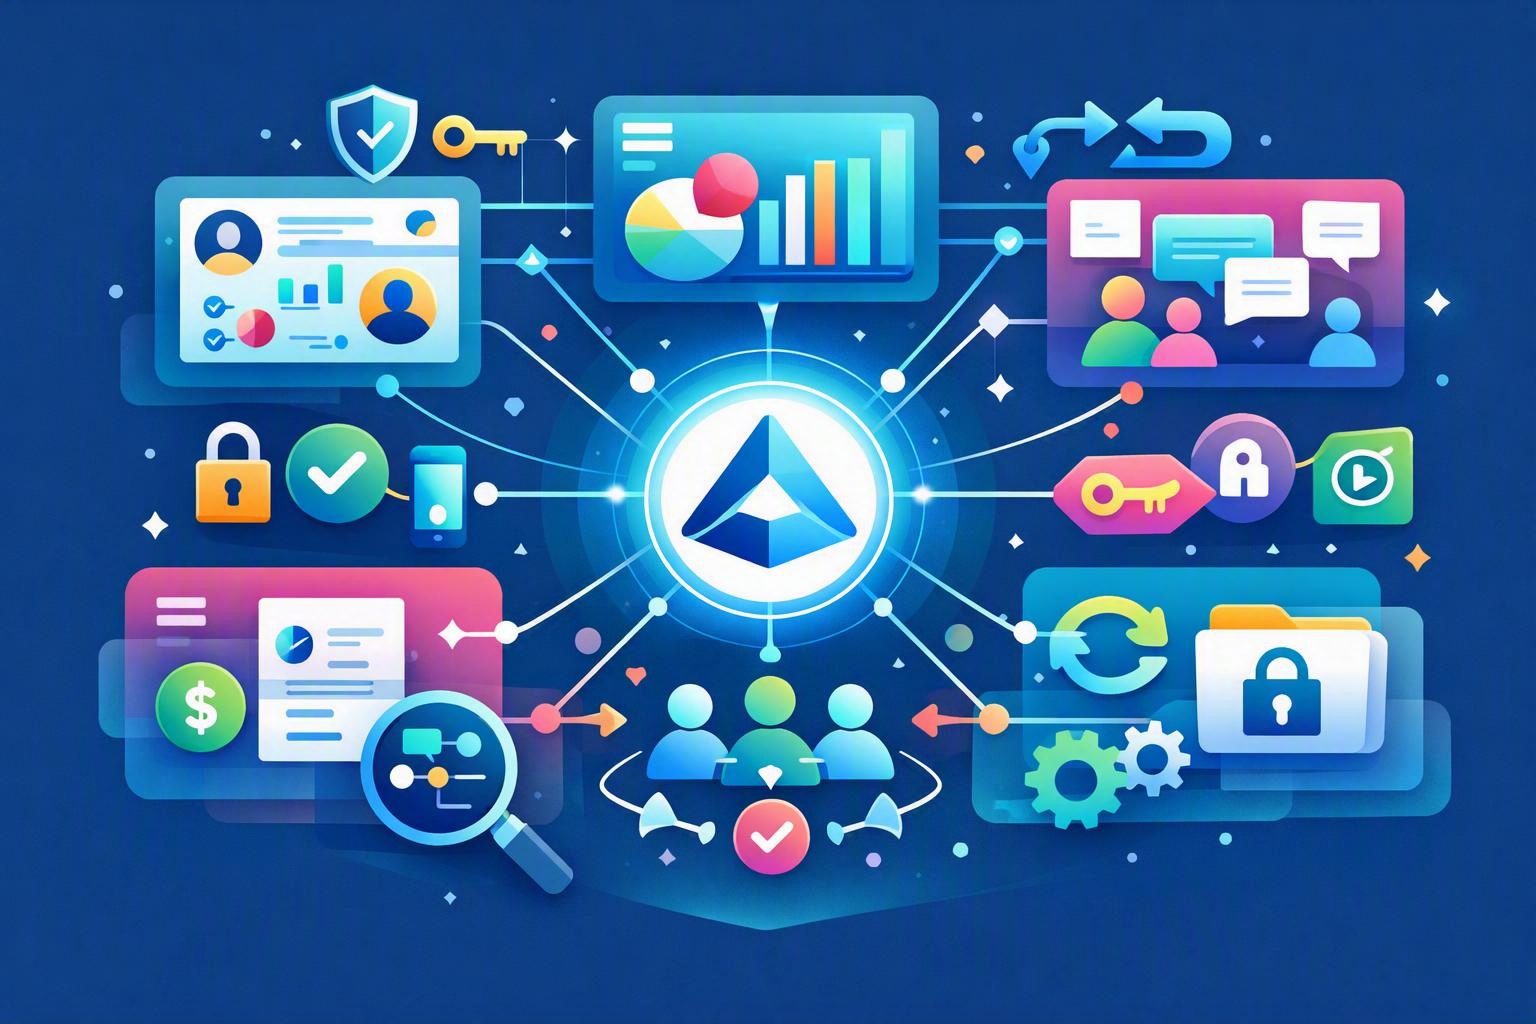
De stærkeste customer success programmer kombinerer produktdata, betalingsstatus, engagement og kundedialog i én samlet platform.
Marketing- og engagementssignaler giver også vigtig indsigt. Kunder, der stopper med at åbne produktkommunikation, ignorerer onboardingmateriale eller ikke længere deltager i webinars, mister ofte gradvist relationen til produktet. Når marketing, abonnementer og kundedialog samles i én løsning som abonnements- og faktureringsstyring, bliver det langt lettere at identificere mønstre på tværs af hele kunderejsen.
Derudover gør fælles platformdata ugentlige reviews mere operationelle. I stedet for manuelle regneark kan teams prioritere konti ud fra sundhedsscore og seneste ændringer. Det kræver dog tydeligt ejerskab. Customer success, support og salg bør alle vide præcist, hvem der reagerer på faldende usage, betalingsfriktion eller ændringer i engagement.
AI og automatisering spiller samtidig en større rolle i moderne SaaS-organisationer. Platforme kan analysere aktivitetsmønstre, mødenoter og kundeadfærd samlet for at identificere tilbagevendende problemer og foreslå næste handling. Automatisering fungerer dog bedst, når grunddata er strukturerede og samlet ét sted. Målet er ikke at erstatte relationen til kunden, men at frigøre tid til mere relevante samtaler og strategisk rådgivning.
Næste skridt for et stærkere customer success setup
Et velfungerende customer success program bliver mest effektivt, når det integreres direkte i virksomhedens drift. SaaS-virksomheder opnår typisk størst effekt ved at starte enkelt med få nøglesignaler, faste review-processer og klare workflows fremfor komplekse predictive modeller.
- Saml CRM, support, abonnementsdata og produktaktivitet i én fælles kundetidslinje.
- Byg en enkel sundhedsscore med tydelige grønne, gule og røde risikoniveauer.
- Definér klare playbooks og ejerskab, så opfølgning bliver operationel og konsekvent.
- Brug automatisering og AI til at identificere signaler tidligt, men behold fokus på relationen til kunden.
Hvis du arbejder med retention, churn eller customer success i en SaaS-virksomhed, kan det være værd at samle kundedata og abonnementsstyring i én platform, så beslutninger træffes på baggrund af faktiske signaler fremfor mavefornemmelser. Læs mere om MainFoundry på www.mainfoundry.com eller kontakt teamet via kontaktformularen her.
Related Reading
Læs også mere om CRM og kontaktstyring samt abonnements- og faktureringsstyring for at styrke dit samlede SaaS setup.