Blog

  • KPI Dashboard Best Practices for Business Success

    KPI Dashboard Best Practices for Business Success

    Every successful business eventually outgrows static spreadsheets and fragmented reports. The shift toward KPI dashboards represents a turning point—one where real-time visibility replaces guesswork, and decisions become grounded in measurable outcomes. In this post, we’ll explore how these dashboards transform scattered data into actionable insight, highlight the different types suited for specific teams, and share practical steps to build a dashboard that actually drives business success.

    Turning Data into Action with KPI Dashboards

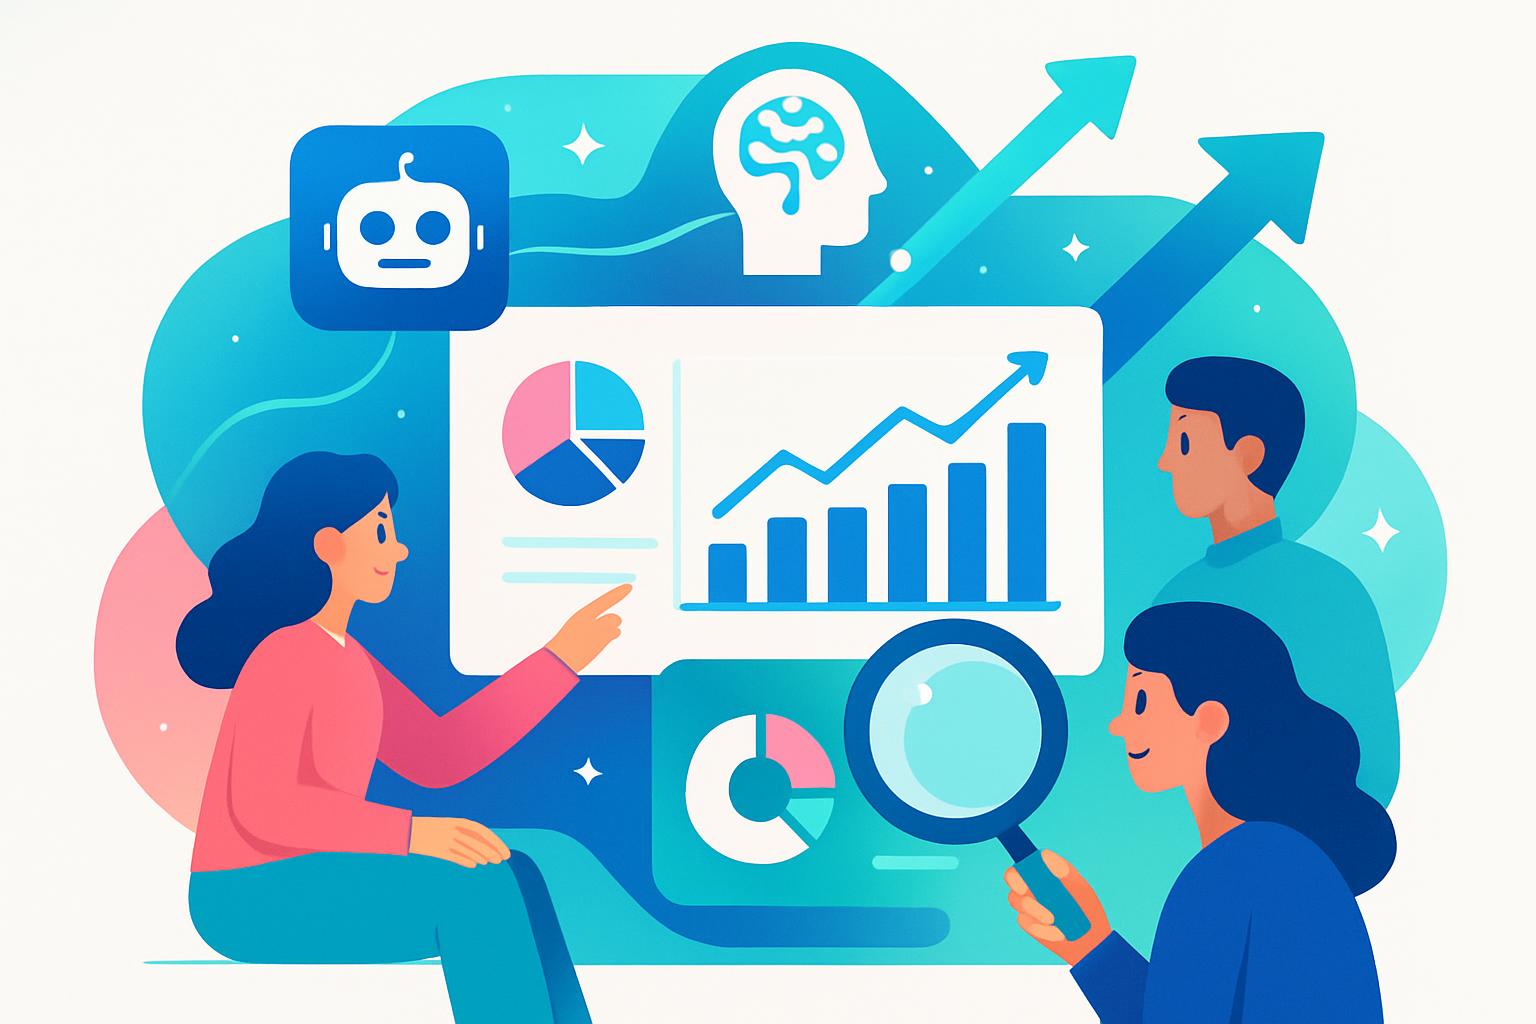
    A KPI dashboard acts as a visual command center that consolidates performance metrics—such as revenue growth, conversion rates, and customer churn—into one place. Leaders no longer need to jump between departmental reports. Instead, they gain real-time visibility across marketing, finance, and operations at a glance, empowering faster and more confident decision-making.

    Modern dashboards update automatically by connecting directly to tools like CRMs, accounting systems, and marketing platforms. For example, MainFoundry provides seamless integrations so that when your finance track cash flow or marketing measures conversion, each department works off the same live data. This unified perspective drives alignment, accountability, and ultimately, stronger business outcomes.

    “KPI dashboards turn raw numbers into clarity, giving leaders real-time insight into what’s working and what’s not.”

    Pro Tip: Keep dashboards focused on five to ten strategic KPIs. Too many metrics dilute insight and slow action.

    Key Dashboard Types and What They Reveal

    Not all dashboards are the same. The most effective version reflects how your business operates—and how your teams make decisions day to day. Executive dashboards summarize financial KPIs like ROI and revenue growth, while operational dashboards monitor productivity, order timings, and workflow efficiency. Analytical dashboards dig deeper into performance patterns and anomalies, often leveraging AI to uncover root causes. Industry-specific dashboards, built on customizable platforms like MainFoundry’s custom workspaces, adapt metrics to unique business models—be it SaaS, manufacturing, or retail.

    Connecting these insights in one view allows teams to spot correlations between metrics that might otherwise stay hidden. For example, a sudden drop in net promoter score could correspond with declining order fulfillment efficiency—a connection visible instantly on a combined dashboard.

    • Actionable insights: Identify trends early and react before they affect performance.
    • Alignment and accountability: Keep everyone focused on shared objectives in one consistent view.
    • Efficiency gains: Reduce manual reporting through automated updates from connected systems.
    • Improved forecasting: Access real-time data to make confident predictions and strategic decisions.

    Building a KPI Dashboard That Drives Results

    An effective dashboard does more than look good—it connects strategy, data, and culture. Begin by defining clear objectives and selecting KPIs tied directly to business outcomes rather than activity. Integrate data sources across CRM, finance, and marketing tools using platforms such as MainFoundry’s billing management tools to eliminate silos and ensure accuracy. Design intuitive visuals with color-coded signals—green for success, yellow for potential risk, and red for issues—and always provide context on data spikes or drops for actionable interpretation.

    Treat dashboards as living systems, reviewed collectively in recurring meetings. This practice keeps teams aligned as goals evolve and transforms the dashboard from a static report into a dynamic feedback loop guiding continuous improvement.

    Key Takeaways

    • A KPI dashboard creates a single source of truth that connects every department to real-time data.
    • Focus only on KPIs that reflect genuine progress toward business goals to maintain clarity and impact.
    • Design visuals that highlight priorities and reveal performance patterns at a glance.
    • Collaboratively review dashboard insights to foster accountability and continuous improvement.
    • Explore MainFoundry’s all-in-one platform to unify CRM, marketing, and finance metrics into one connected workspace.

    Related Reading

    Check out MainFoundry’s Marketing Analytics Suite for deeper insights on integrating campaign data into your KPI strategy.

  • Essential SaaS Metrics Every Business Should Track

    Essential SaaS Metrics Every Business Should Track

    In the world of software-as-a-service, success isn’t defined solely by new signups. It’s about understanding what drives sustainable growth—your recurring revenue, profitability, and customer loyalty. Tracking the right SaaS metrics ensures you don’t just measure success but continuously refine your product, pricing, and acquisition strategy. This post breaks down the essential KPIs every SaaS business should monitor, featuring insights on financial health, customer acquisition efficiency, and retention—plus how platforms like MainFoundry simplify it all.

    Financial Metrics That Define SaaS Growth

    Predictable revenue fuels every SaaS model. Monthly Recurring Revenue (MRR) and Annual Recurring Revenue (ARR) are the twin pillars of financial visibility. MRR gives a snapshot of consistent monthly income, while ARR—MRR multiplied by 12—illustrates long-term strength for investors and internal forecasting. Monitoring both helps founders understand stability and future trajectory.

    Equally insightful are Average Revenue Per Account (ARPA) and Average Revenue Per User (ARPU), which show how much value each customer contributes. A rising ARPU usually signals effective upselling or higher perceived product value. For example, companies expanding client tiers can expect ARPA to strengthen in line with customer growth.

    Further financial clarity comes from analyzing Annual Contract Value (ACV). When ACV grows, it typically reflects longer-term trust and improved deal quality. By bringing MRR, ARR, and ACV together, leadership teams gain not only a snapshot of stability but insight into revenue scalability. MainFoundry’s finance module automates these calculations and visualizes patterns in real time, connecting financial KPIs directly with CRM and marketing data for smarter forecasting.

    “Revenue predictability isn’t just a financial metric—it’s the foundation of strategic clarity and investor confidence.”

    Customer Acquisition, Retention, and Operational Efficiency

    Customer Acquisition Cost (CAC) and CAC Payback Period serve as the reality check for growth strategies. CAC reveals how much it costs to win each new customer, while payback period shows how long it takes to recoup that spend. High costs or slow paybacks can expose inefficiencies in marketing channels—insights that help SaaS operators fix scaling bottlenecks before they impact cash flow.

    Understanding momentum over time is equally vital, and the Lead Velocity Rate (LVR) captures just that—tracking how fast qualified leads grow month over month. When your LVR increases consistently, it often predicts stronger upcoming MRR. However, retention keeps that momentum sustainable. The Churn Rate quantifies customer loss, while Net Revenue Retention (NRR) layers in upgrades and downgrades to reflect true customer health. High NRR means customers not only stay but expand their spending—a signal of strong product-market fit.

    Pairing Customer Lifetime Value (LTV) with CAC sharpens perspective. A LTV:CAC ratio near 3:1 is widely considered healthy, showing that acquisition spend generates durable returns. Integrated platforms like MainFoundry’s CRM and Marketing Analytics make it simpler to measure these KPIs collectively—combining campaign data, retention dashboards, and account insights in one workspace.

    Operationally, pairing efficiency with profitability gives the full picture. The Rule of 40 blends growth rate and margin—if the sum equals or exceeds 40%, your SaaS is balancing scale with stability. Add metrics like burn rate, runway, and gross margin to track durability. Tools such as MainFoundry’s AI Assistant automatically surface alerts when churn or margins shift, helping teams stay ahead rather than react.

    Pro Tip: Monitor NRR and Churn together—when NRR rises faster than churn declines, your upsell strategy is outperforming retention losses.

    Key Takeaways

    • Track predictability first: MRR and ARR are the heartbeat of SaaS stability and investor confidence.
    • Put efficiency metrics to work: CAC, LTV, and Rule of 40 help reveal how sustainable your scaling model really is.
    • Retention drives momentum: NRR and churn rates are critical for understanding customer value beyond acquisition.
    • Integrate your data: Combining CRM, marketing analytics, and finance insights uncovers connections hidden in silos.
    • Automate reporting: AI platforms like MainFoundry’s AI suite cut hours of manual data work and turn complex KPIs into actionable insight.

    Related Reading

    Explore how unified CRM strategies and finance analytics can help SaaS companies refine their growth models for long-term resilience.

  • Boost Customer Retention with CRM Strategies

    Boost Customer Retention with CRM Strategies

    Keeping your existing customers is one of the smartest ways to ensure sustainable business growth. While acquiring new buyers often grabs attention, it’s your customer retention rate (CRR) that truly determines long-term profitability. Understanding how to measure and improve retention allows you to identify growth opportunities before churn erodes your revenue base. In this guide, we’ll reveal how CRR is calculated, what supporting metrics sharpen your analysis, and which strategies and tools you can use to retain more customers effectively.

    How to Measure Customer Retention Rate

    The formula to calculate your customer retention rate is simple yet powerful: CRR = ((E - N) / S) × 100. Here, E stands for the total customers at the end of a period, N represents new customers gained, and S is your starting customer count. For instance, if you start with 2,500 customers, gain 600 new ones, and end with 2,800, the calculation gives you an 88% retention rate. That indicates strong loyalty, but also highlights space for optimization.

    Analyzing CRR in isolation doesn’t tell the full story. To get useful insights, compare it with complementary metrics such as churn rate, repeat purchase rate (RPR), customer lifetime value (CLV), and satisfaction indicators like Net Promoter Score (NPS) or Customer Satisfaction Score (CSAT). These help pinpoint the reasons behind retention trends rather than just the outcomes.

    For example, if a company notices RPR dropping below 20% while CLV shrinks simultaneously, it’s a red flag that customer experience or support processes may be weakening. Similarly, declining CSAT scores often reveal bottlenecks that prevent customers from returning. Platforms such as MainFoundry’s marketing analytics connect these insights across engagement points, letting you see how satisfaction metrics align with specific actions and campaigns.

    “When CRM, marketing, and analytics tools operate together, raw data transforms into actionable insight rather than disconnected reports.”

    Using integrated platforms such as MainFoundry’s CRM, you can visualize customer behavior trends, automate reports, and spot warning signs before churn occurs. With engagement and performance synchronized, every metric becomes a lens for proactive action.

    Practical Ways to Improve Customer Retention

    Improving retention requires consistent listening and swift action. Begin by tracking feedback through NPS and CSAT surveys. Promoters signal loyalty worth nurturing, while detractors highlight friction areas that demand change. For instance, when detractors point to delayed responses, linking CRM case handling with task management ensures prompt follow-up and demonstrates professionalism.

    Segmentation unlocks another layer of insight. Using predictive CLV models, you can identify which segments of customers offer the greatest potential. Tailoring messages, loyalty rewards, or renewal incentives based on these insights improves conversion and engagement rates. Tools like MainFoundry’s billing solutions can automatically trigger outreach or renewal alerts when customer value thresholds or churn risks change.

    Businesses that unify CRM, marketing, and finance see up to 30% faster response times and higher customer loyalty scores.

    A unified workspace closes the loop between teams. Sales, marketing, and service can access every client conversation, order, and note in a single timeline. With platforms like MainFoundry Workspaces, organizations can visualize retention objectives through customizable boards, track progress, and assign follow-ups effortlessly. This collaboration encourages accountability and transparency across departments.

    Pro Tip: Use automation rules within your CRM to flag customers showing signs of disengagement, like reduced logins or slower purchase cycles, so you can act before churn occurs.

    Key Takeaways

    • Continuously track your CRR and associated metrics to gauge loyalty performance over time.
    • Combine metrics like churn, CLV, and NPS for a complete understanding of customer behavior.
    • Act on feedback quickly to turn insights into measurable retention improvements.
    • Use customer segmentation powered by predictive analytics to tailor retention campaigns.
    • Leverage unified systems like MainFoundry’s AI-enabled platform to automate workflows and gain full visibility.

    Customer retention success goes beyond maintaining high numbers—it’s about building relationships grounded in trust and relevance. By measuring the right indicators and acting early, you strengthen your ability to deliver value again and again. Contact MainFoundry to learn how unified analytics and automation can help your business turn retention insights into lasting growth.

    Related Reading

    For more on customer analytics and CRM strategy, explore How Unified CRM Platforms Drive Customer Growth.

  • CRM Best Practices to Optimize Customer Acquisition Cost

    CRM Best Practices to Optimize Customer Acquisition Cost

    Understanding your Customer Acquisition Cost (CAC) is one of the most powerful ways to gauge how efficiently your business is growing. CAC reflects what you spend on marketing and sales to bring in each new customer. When measured correctly, it reveals whether your growth is sustainable and scalable. This guide explains how to calculate CAC, interpret its meaning, and optimize it for better long-term profitability. You’ll also learn how platforms like MainFoundry can simplify tracking and improve your acquisition performance.

    How to Calculate and Interpret Customer Acquisition Cost

    At its core, CAC is straightforward: total sales and marketing costs divided by the number of new customers acquired. However, understanding what counts as “sales and marketing costs” is essential for accurate measurement. These costs generally include advertising budgets, team salaries, CRM and analytics tools, outsourced services, and content production. For instance, if you spend $50,000 and bring in 1,000 new customers, your CAC is $50 per customer.

    To keep results meaningful, measure CAC consistently—monthly, quarterly, or annually—and categorize expenses carefully. This allows you to see trends in acquisition efficiency and react quickly when costs rise. Adopting what’s called a fully loaded CAC offers a clearer picture by including overhead, creative expenses, and operational costs beyond direct marketing or sales. That level of detail prevents underestimating what it truly costs to grow.

    Customer Acquisition Cost = Total Sales & Marketing Costs ÷ Number of New Customers Acquired

    Integrated data platforms simplify this process dramatically. For example, MainFoundry’s Marketing Analytics connects campaign performance directly with expense tracking and customer conversions. Instead of scattered spreadsheets, automated reporting keeps your CAC metrics up to date across all marketing channels in one dashboard.

    “Accurate CAC calculations transform guesswork into strategy—giving every marketing dollar a measurable return.”

    Optimizing CAC Through Smarter Acquisition and Retention

    Reducing CAC doesn’t mean cutting spend—it means spending more efficiently. The best way to judge that efficiency is through the Customer Lifetime Value (CLV):CAC ratio. This metric compares the total value of a customer over time with how much it cost to acquire them. A balanced ratio of around 3:1 is ideal, meaning you spend roughly one-third of a customer’s lifetime value acquiring them. Anything lower suggests your acquisition model needs refinement.

    Optimizing CAC involves three critical areas of focus that together drive long-term profitability and sustainable growth.

    • Channel Optimization: Identify which marketing channels deliver the most profitable customers and allocate more resources to these areas for better ROI.
    • Retention Strategy: Enhance customer lifetime value through exceptional experiences and strategic upselling, enabling higher CAC with sustained profitability.
    • Technology Integration: Unify acquisition, retention, and financial data within connected systems for comprehensive decision-making.

    MainFoundry CRM and Finance Management offer integrated visibility into customer journeys—from first interaction to recurring payments. This unified data lets you trace the true impact of every campaign, revealing how retained customers contribute to CAC reduction over time.

    Pro Tip: Even small automations—such as personalized follow-ups through MainFoundry’s AI Assistant—can reduce acquisition costs while improving customer engagement.

    Key Takeaways

    Reducing Customer Acquisition Cost requires alignment, precision, and proactive optimization across marketing, sales, and finance. By quantifying what it takes to win and keep each customer, you can invest strategically and scale sustainably. Remember these essential points:

    • Include all relevant acquisition expenses in your CAC calculation for accurate forecasting.
    • Use the CLV:CAC ratio to ensure that acquisition efforts support profitable growth.
    • Integrate marketing analytics, CRM, and financial systems to make CAC insights actionable.
    • Leverage platforms like MainFoundry to automate tracking, unify data, and enhance reporting at scale.

    Related Reading

    Explore more insights on growth metrics in our guide to Calculating Customer Lifetime Value (CLV).

  • Forstå og forbedr din konverteringsrate med CRM

    Forstå og forbedr din konverteringsrate med CRM

    At forstå og forbedre din konverteringsrate er en af de mest værdifulde discipliner i digital marketing. Det handler ikke bare om at få flere besøgende, men om at sikre, at flere af dem faktisk udfører den ønskede handling – hvad enten det er et køb, en tilmelding eller en kontaktforespørgsel. Denne artikel dykker ned i, hvordan du måler, analyserer og optimerer konverteringsraten, hvorfor den har så stor forretningsmæssig betydning, og hvilke praktiske metoder du kan bruge til at forbedre resultaterne på tværs af kanaler.

    Hvad er konverteringsrate og hvorfor den betyder noget

    Kort fortalt viser konverteringsraten, hvor stor en procentdel af dine besøgende, der udfører en ønsket handling – for eksempel et køb eller en formularudfyldning. Den udregnes som antallet af konverteringer divideret med antallet af besøgende, ganget med 100. En side med 1.000 besøgende og 30 køb har således en konverteringsrate på 3 %. Dette tal giver hurtigt et overblik over, hvor effektivt siden præsterer i forhold til sit formål.

    Dog giver raten kun mening i kontekst af trafikkvalitet og konverteringsværdi. Ti små salg kan for eksempel være mindre rentable end to store køb, og derfor bør metrikken altid vurderes sammen med omsætning og kundelevetid. En høj konverteringsrate betyder ikke nødvendigvis stor fortjeneste, men det indikerer, at siden effektivt omsætter trafik til handlinger af værdi.

    “Konverteringsrate er mere end et tal – det er et spejl af, hvor godt din digitale strategi omsætter brugerinteresse til forretningsværdi.”

    Hvordan du forbedrer konverteringsraten i praksis

    En god konverteringsrate betyder, at du får mere ud af den samme mængde trafik. Selv en forbedring på blot én procent kan have stor økonomisk effekt – især hvis du arbejder med mange besøgende eller høje klikpriser. Ifølge MainFoundry’s marketing analytics kan du måle præcist, hvilke kampagner der skaber konverteringer, og hvilke der blot trækker besøgende uden værdi.

    Et højt konverteringsniveau afspejler som regel en intuitiv brugeroplevelse og et klart budskab. Små friktioner som langsomme sider, uklare call-to-actions eller for mange trin i et køb kan dramatisk sænke raten. Derfor er principperne fra conversion rate optimization (CRO) essentielle. Det handler ikke kun om design, men om hele brugeroplevelsen fra første klik til endelig handling.

    • A/B-testning for at finde ud af, hvilke versioner af sider og annoncer der konverterer bedst.
    • Formularforenkling og tydelig værdiargumentation for at reducere opgivelsesraten.
    • Mobiloptimering fordi en stor del af trafikken kommer fra smartphones.
    • Automatisk opfølgning via CRM, så leads ikke tabes efter første kontakt.

    Ved at bruge et samlet system som MainFoundry CRM kan du automatisere både dataindsamling og analyse. Platformen viser hele kunderejsen – fra første besøg til køb – og kan endda, via AI Assistenten, foreslå præcise optimeringsområder baseret på historiske data. Dermed handler optimering ikke længere om gætteri, men om dokumenteret indsigt og intelligent beslutningstagning.

    Pro Tip: Følg altid op på ændringer med konkrete data. Evaluer, test og finjuster – konverteringsoptimering er en kontinuerlig proces, ikke en engangsopgave.

    Key Takeaways

    En målrettet indsats for at forbedre konverteringsraten er en investering i virksomhedens vækst og rentabilitet. Fokuser på datadrevne beslutninger, test løbende dine budskaber, og optimer brugeroplevelsen. Hellere færre besøgende med høj købslyst end mange, der ikke handler. Ved at automatisere måling og opfølgning med en samlet marketing- og CRM-løsning som MainFoundry får du både indsigt og værktøjer til at skabe vedvarende forbedringer.

    Related Reading

    Læs også om hvordan du bruger marketing analytics til løbende optimering og få flere konkrete indsigter til din digitale strategi.

  • Marketing Attribution Best Practices for Smarter Channel Insights

    Marketing Attribution Best Practices for Smarter Channel Insights

    Understanding which marketing channels truly drive conversions has become both crucial and complex. Buyers rarely take a straight path to purchase—they engage across emails, social posts, ads, and websites before deciding. This post explains how marketing attribution connects those interactions to reveal not only what converted but *why*. You’ll discover how attribution improves decision-making, which models offer the most insight, and how unified tools like MainFoundry’s marketing analytics simplify cross-channel measurement for smarter growth.

    How Marketing Attribution Reveals the Real Impact of Your Channels

    At its core, marketing attribution determines which customer interactions lead to a conversion. That might mean the first ad a prospect sees, the nurturing email that re-engaged them, or the final demo that closed the sale. When these touchpoints are analyzed collectively, marketers get visibility that transcends simplistic “last-click” assumptions.

    Attribution uncovers patterns like social ads driving early awareness that later translates into paid search conversions. It also highlights underestimated influences—for instance, an automated email journey that steadily warms leads before they reach out to sales. These insights help teams shift focus from volume-driven metrics to those that genuinely improve revenue efficiency.

    “Modern attribution doesn’t just show what converted—it reveals the hidden story behind customer decisions.”

    Platforms such as MainFoundry make attribution seamless by integrating CRM, analytics, and financial data. This enables tracking from ad impressions to purchases—all within one environment—giving marketing teams a unified view of performance rather than fragmented channel reports.

    Key benefits of effective marketing attribution include improved cross-channel clarity, faster optimization decisions, and more accurate ROI calculations, ultimately driving transparency and accountability across the organization.

    Choosing the Right Attribution Model for Insightful Decision-Making

    Every organization needs an attribution model that matches its goals. Single-touch models—like first-click or last-click—are straightforward but limited, crediting only one interaction. While they offer useful top-level views, they fail to capture the full influence of multi-channel marketing strategies.

    In contrast, multi-touch models such as linear or time-decay offer a balanced distribution of credit. They consider multiple steps along the customer journey, giving more weight to actions that occur closer to conversion. For teams seeking deep insight, data-driven models leverage machine learning to map impact dynamically based on real performance data.

    Solutions like MainFoundry’s marketing analytics dashboard help you explore model outcomes side-by-side and connect attribution results directly with your CRM data. This integration makes it easier to align marketing results with revenue, giving your team reliable clarity on what’s driving business growth.

    Pro Tip: Establish attribution windows that match your typical sales cycle so delayed conversions are properly accounted for in your reporting.

    Privacy trends are reshaping attribution frameworks as third-party cookies phase out. Modern tools like MainFoundry’s AI-powered platform use privacy-safe datasets and server-side tracking to maintain measurement accuracy while adhering to compliance standards.

    Key Takeaways

    • View marketing as a journey: Attribution links each touchpoint to create a clear story of conversion influence.
    • Match model to goals: Simpler models suit trend identification; data-driven ones guide strategic decisions.
    • Unify your data: Integrated CRM, analytics, and finance systems prevent fragmented insights and enable truth-based measurement.
    • Prioritize privacy-first approaches: Cookieless tracking and first-party data will define attribution’s future accuracy.
    • Choose platforms built for integration: MainFoundry connects campaigns, customer data, and financials to clarify where growth truly originates.

    Related Reading

    Dive deeper into unified analytics by exploring MainFoundry’s marketing analytics platform overview.

  • Lead Scoring Strategies That Improve CRM Results

    Lead Scoring Strategies That Improve CRM Results

    Every business faces the same struggle—too many leads, not enough time. The real challenge isn’t attracting prospects; it’s knowing which ones are most likely to convert. That’s where lead scoring comes in. By assigning numerical values to leads based on behavior, engagement, and demographic fit, you can focus resources on high-potential opportunities. In this post, we’ll explore how lead scoring strengthens the connection between marketing and sales, how to build a scoring framework, and how platforms like MainFoundry’s CRM and marketing analytics tools make data-driven prioritization both efficient and scalable.

    Why Lead Scoring Bridges Marketing and Sales

    Lead scoring acts as the connection point between how marketers measure interest and how sales teams define opportunity. Instead of relying on gut feeling about who seems ready to buy, teams apply measurable criteria. These include explicit factors such as industry or job title, and implicit factors like website visits or engagement with content.

    For instance, if a prospect frequently visits your pricing page, engages with several product videos, and books a demo, those combined behaviors signal high buying intent. Once they surpass a “Marketing Qualified Lead” threshold, sales reps know it’s time to act. This alignment minimizes wasted effort and ensures that energy is focused on leads that are truly ready to convert.

    “Lead scoring transforms marketing activity into actionable sales opportunities—converting guesswork into growth.”

    Tools like MainFoundry’s AI Assistant enhance this alignment by automating data assessment. Its algorithms analyze CRM and marketing signals to adjust scoring models dynamically, ensuring they evolve as buyer behavior shifts. The outcome is a fluid, accurate reflection of real-time intent that empowers teams to move quickly on genuine opportunities.

    Building a Lead Scoring Framework That Works

    Creating an effective lead scoring model begins with collaboration. Marketing and sales must agree on what defines a quality lead and what actions show real interest. Explicit factors might include company size or role level, while engagement-based signals—such as email clicks or webinar registrations—determine intent.

    Assign values to each interaction: a whitepaper download could be worth five points, while scheduling a demo might contribute twenty. Once scores cross a designated MQL threshold, automation can trigger notifications so sales teams act immediately. Platforms like MainFoundry streamline this process, uniting your marketing analytics with CRM data to present every engagement in a single timeline.

    Pro Tip: Use custom workspaces to visualize how campaigns produce high-scoring leads and direct future optimizations.

    For growing businesses, predictive scoring takes this foundation further. By feeding in historical conversion data and third-party firmographic insights, AI-driven systems refine predictions over time. This not only increases accuracy but gives teams statistical confidence in focusing on leads with genuine purchase potential—helping marketing and sales operate as one cohesive revenue engine.

    Key Takeaways

    • Lead scoring helps teams prioritize leads by identifying who’s ready to buy and where to focus outreach.
    • Align marketing and sales with a shared definition of lead quality for smoother handoffs and stronger collaboration.
    • Automate the process using MainFoundry’s CRM and AI tools to continually refine lead prioritization.
    • Use predictive scoring models to adapt to new data and optimize your future campaigns.
    • Continually audit and improve score criteria so your model stays aligned with actual buyer behavior.

    Related Reading

    Discover how MainFoundry’s unified business platform automates scoring, integrates analytics, and keeps your most valuable leads front and center.

  • Building an Effective Sales Pipeline That Works

    Building an Effective Sales Pipeline That Works

    A sales pipeline is not just a visual chart—it’s the lifeblood of your sales operations, guiding teams from first contact to closed deals. When structured effectively, it ensures that every rep knows where to focus, revenue forecasts become more accurate, and leadership can quickly spot bottlenecks. This guide breaks down exactly what a pipeline is, how it differs from a funnel, and how to build one tailored to your organization. You’ll also see how platforms like MainFoundry’s CRM bring automation and clarity to every stage of your process.

    What Is a Sales Pipeline and Why It Matters

    At its core, a sales pipeline visually represents the stages every prospect moves through—from awareness to purchase and beyond. These stages define key activities, ownership, and checkpoints. It acts as a roadmap for your team, helping to prioritize outreach while giving insight into future revenue. The pipeline differs from the sales funnel in that it focuses on tangible actions and progress, rather than just conversion percentages or volume tracking.

    Every business will structure its pipeline differently depending on deal complexity. A fast-paced, transactional team might need only five or six stages, while enterprise-level sales cycles often track eight or nine nuanced steps. Still, most pipelines follow a common structure that includes prospecting, qualification, discovery, proposal, negotiation, closing, and follow-up. Each of these helps keep opportunities moving rather than getting lost between handoffs or communications.

    “A structured pipeline isn’t just a management tool—it’s a strategic map of every deal’s journey from lead generation to success.”

    Without this level of structure, forecasting becomes guesswork and opportunities easily slip through the cracks. With it, however, teams can track who owns each deal, understand where momentum stalls, and apply consistent criteria to advance prospects effectively.

    How to Build an Effective Sales Pipeline from the Ground Up

    Creating a high-performing pipeline begins with understanding how your customers actually buy. This means aligning stages and actions with realistic buying behaviors rather than forcing a one-size-fits-all model. The process can be broken down into five practical steps—each reinforcing the foundation of predictable growth and measurable improvement.

    • Gather data inputs like revenue goals, win/loss ratios, and existing sales activities to set realistic targets. Modern CRMs such as MainFoundry pull this information automatically into visual dashboards.
    • Define stages that reflect buyer decisions and internal checkpoints. Clarify entry and exit criteria, core activities, and measurable outcomes so your team always knows when to progress an opportunity.
    • Populate your pipeline with qualified prospects segmented by relevant factors such as territory or persona. Using a unified CRM ensures every email, call, or meeting automatically connects to the right record.
    • Align team activities with stage ownership. Inside sales might handle prospecting, while account executives lead proposal and negotiation phases—a structure that prevents deals from getting “stuck.” Tools like MainFoundry’s Workspaces and Task Management features ensure accountability and timely follow-up.
    • Track and optimize performance regularly using metrics such as pipeline velocity and stage-conversion rate. With integrated analytics from MainFoundry Marketing, you can trace campaign efficiency and fine-tune your forecasts.

    Pro Tip: Review your pipeline weekly for signs of bottlenecks or stalled deals. Even small adjustments—like redefining proposal criteria or reassigning ownership—can lead to major gains in velocity and conversion.

    Key Takeaways

    • Build your sales stages around how buyers truly make decisions, not internal assumptions.
    • Establish clear entry and exit criteria for each stage to bring consistency and transparency.
    • Track conversion rates and velocity to uncover and resolve bottlenecks quickly.
    • Use integrated platforms like MainFoundry CRM to centralize data and automate tasks across your sales process.
    • Regularly review insights to refine your approach and build a scalable, data-driven path to consistent growth.

    Related Reading

    Explore the MainFoundry Workspaces guide to learn how tailored pipelines streamline deal management and improve overall sales effectiveness.

  • Sådan optimerer du kundelivscyklussen med CRM

    Sådan optimerer du kundelivscyklussen med CRM

    At forstå kundelivscyklus er nøglen til at skabe vedvarende kundeforhold og styrke virksomhedens vækst. Denne artikel udforsker hele kundens rejse – fra første kontaktpunkt til loyal ambassadør – og viser, hvordan en datadrevet tilgang kan maksimere kundelivstidsværdi. Du lærer, hvordan platforme som MainFoundry CRM samler marketing, salg og supportdata i ét samlet billede af kunderejsen. Gennem praktiske eksempler ser vi, hvordan du kan identificere nøglefaser, optimere interaktioner og opbygge loyalitet, der varer ved.

    Hvad Er Kundelivscyklus og Hvorfor Er Den Vigtig?

    En kundelivscyklus beskriver de faser, en kunde gennemgår – fra første kendskab til brandet til gentagne køb og loyalitet. Modellen består typisk af fem trin: kendskab, anskaffelse, konvertering, fastholdelse og loyalitet. Når du forstår denne struktur, kan du sætte ind dér, hvor den største effekt opnås – hvad enten det er at forbedre konverteringer eller styrke relationer efter salget.

    I kendskabsfasen møder kunder din virksomhed for første gang via marketingkampagner eller anbefalinger, hvilket danner deres første indtryk. Under anskaffelse indsamles kontaktdata, og interessen udvikles til reel dialog. Ved konvertering bliver leadet til en betalende kunde gennem relevant kommunikation og klar værdi. Fastholdelsesfasen handler om at skabe tilfredse oplevelser gennem service, onboarding og opfølgning, mens loyalitetsfasen opstår, når kunder bliver gentagne ambassadører for dit brand.

    “En veldesignet kundelivscyklus gør det muligt at forvandle analyser til handling – og handling til loyale kunder.”

    Ved hjælp af værktøjer som MainFoundry Marketing Analytics kan virksomheder identificere, hvor kunder falder fra, og justere strategien for at forbedre oplevelsen. Når konverteringsdata forbindes med CRM’et, bliver kunderejsen gennemsigtig, og optimisering kan ske med præcision.

    Hvordan Du Aktivt Styrer Kundelivscyklussen

    Effektiv styring kræver indsigt, automatisering og et stærkt kundefokus. Ved at kortlægge hele kunderejsen får du synlighed i alt fra de første klik til køb og fastholdelse. Denne viden kan omsættes til målrettede handlinger som personaliserede kampagner, automatiseret opfølgning og dynamiske tilbud, der øger engagement og loyalitet.

    Et CRM-system som MainFoundry CRM letter denne proces gennem automatisk berigelse af data, historiklogning og rapportering i dashboards, hvor du kan følge kundens engagement over tid. Sammenkoblet med økonomidata fra MainFoundry Billing kan du tydeligt se sammenhængen mellem kundeloyalitet og omsætning – og bruge denne viden til at prioritere indsatsen.

    Pro Tip: Brug AI-drevne analyser som MainFoundry AI Assistent til at identificere kunder med høj fornyelses- eller opsalgsgrad og skræddersy strategier til dem.

    Da kundernes adfærd ændrer sig kontinuerligt, må livscyklussen aldrig være statisk. Det er vigtigt at løbende justere kommunikation, kampagner og loyalitetsinitiativer på baggrund af dataindsigter. På den måde forvandles analyser til handling, der skaber konkrete resultater og udvikler kunder fra engangskøbere til faste brandfortalere.

    Vigtige Pointer og Næste Skridt

    • Se kunderejsen som én sammenhængende helhed fra start til loyalitet.
    • Brug data aktivt til at forudsige kundernes behov frem for kun at reagere på dem.
    • Automatisér gentagne kontaktpunkter for at frigøre tid til relationer og strategi.
    • Mål kundetilfredshed med KPI’er som retention rate og Customer Lifetime Value.
    • Integrér CRM, marketing og økonomi i én samlet løsning via MainFoundry.

    Når du anvender disse principper, vil kunder udvikle sig fra ukendte leads til loyale ambassadører, der aktivt bidrager til virksomhedens vækst. Opdag, hvordan MainFoundry kan forbinde dine data og optimere hele kundelivscyklussen på www.mainfoundry.com.

  • Proven Ways to Measure and Reduce Customer Churn

    Proven Ways to Measure and Reduce Customer Churn

    Customer churn rate may seem like a quiet metric, but it plays a decisive role in shaping business stability and growth. Whether you run a subscription service, SaaS platform, or any recurring billing model, understanding how many customers you lose—and why—can be more predictive of long-term success than acquisition numbers alone. This article breaks down what churn rate means, how to measure it accurately, and the best strategies to reduce it over time with smarter data integration and proactive retention management.

    Understanding Customer Churn Rate and Why It Matters

    At its core, the customer churn rate measures the percentage of clients who stop using your product or service within a given period. It’s essentially the inverse of your retention rate and offers a clear indicator of how well your organization maintains relationships over time. Subscription businesses usually measure churn monthly, though longer intervals like quarterly or yearly can make sense depending on business cycles.

    While acquiring new customers drives headline growth, retention builds lasting stability. High churn suggests issues such as weak product-market fit, poor customer engagement, or operational inefficiencies. Understanding churn isn’t only about seeing who left; it’s about uncovering why they left and identifying opportunities for improvement.

    There are two main types of churn to monitor: customer churn, which looks at the number of accounts lost, and revenue churn, which measures the share of revenue lost due to downgrades, cancellations, or non-renewals. For deeper insight, metrics like Net Revenue Retention (NRR) and Net MRR Churn incorporate expansions or upgrades, offering a more complete picture of revenue dynamics among existing customers.

    Tools such as MainFoundry’s Finance Management tools simplify tracking by automatically measuring Monthly Recurring Revenue (MRR), retention performance, and involuntary churn caused by failed payments—all in real time. By centralizing these financial insights, organizations can see both customer and revenue health at a glance.

    “Churn rate isn’t just a number—it’s a reflection of customer loyalty, satisfaction, and growth potential.”

    How to Calculate and Reduce Customer Churn Effectively

    The most common churn formula is simple: (Lost Customers ÷ Starting Customers) × 100. For example, if you start the month with 5,000 active customers and lose 150 by month’s end, your churn rate is 3%. However, the accuracy of this calculation depends heavily on selecting the right time frame and data inputs.

    Most subscription-based companies measure churn monthly to act quickly on patterns, while others use quarterly or annual assessments based on customer lifecycles. Data integrity also matters: separating voluntary churn (from cancellations) and involuntary churn (from failed renewals) prevents misinterpretation of customer satisfaction. Proper segmentation allows teams to understand which losses reflect disengagement versus payment issues.

    For a financial angle, Revenue Churn = (Lost MRR ÷ Starting MRR) × 100 highlights whether churn is concentrated among high-value accounts or lower-tier users. With MainFoundry’s Marketing Analytics suite, teams can cross-reference churn with campaign attribution to see which acquisition channels yield long-term loyal users.

    Pro Tip: Use cohort analysis to identify when customers are most likely to churn—early lifecycle insights often uncover onboarding gaps and product friction points.

    A cohort-based churn analysis tracks groups of customers who joined during the same period. This method reveals when retention stabilizes and helps pinpoint the critical moments that define a long-term relationship. For instance, you may find that early churn peaks after the first month but declines once users experience key product value.

    Continuous monitoring with MainFoundry’s Custom Workspaces enables teams to visualize churn trends through linked CRM, billing, and engagement data. When all stakeholders share unified metrics, intervention becomes timely and strategic, rather than reactive.

    Reducing churn isn’t about reacting faster—it’s about anticipating friction before it occurs.

    For example, MainFoundry’s CRM tools help teams track customer engagement, automate follow-ups, and flag at-risk accounts early. Integrated call recordings and AI-powered summaries in its Call Intelligence feature can surface recurring objections or support issues that often precede cancellations. By unifying sales, marketing, and operations data, organizations can detect patterns—such as churn spikes after a specific update—and adjust more strategically.

    What Effective Churn Management Looks Like

    Even thriving companies experience churn. The difference lies in how they interpret it. Instead of viewing churn as a failure, successful teams treat it as an optimization lever—an ongoing source of feedback for improving retention, engagement, and profitability. Strong churn management transforms raw data into actionable insight.

    • Monitor both customer churn and revenue churn to see retention through multiple lenses.
    • Segment churn by cohort or campaign to isolate problem patterns and improve experience design.
    • Use real-time alerts to trigger early interventions like renewal reminders or upgrade offers.
    • Correlate churn with engagement and lifecycle data to reveal deeper behavioral triggers.
    • Align cross-functional teams on a shared platform such as MainFoundry to unify insights and execution.

    By consistently pairing churn analytics with behavioral insights, teams can strengthen product adoption and enhance the customer journey. Over time, these insights drive measurable reductions in attrition and increase lifetime value across the customer base.

    Key Takeaways

    • The churn rate quantifies how many customers you lose over time, making it crucial for gauging growth stability.
    • Differentiate between customer churn (accounts) and revenue churn (revenue impact) for full clarity.
    • Analyze churn monthly or quarterly with clean, segmented data to spot trends early.
    • Integrate tools like MainFoundry’s platform to unify CRM, billing, and analytics data for complete retention visibility.
    • Use continuous monitoring and intelligent automation to lower churn sustainably and build durable customer relationships.

    Related Reading

    Check out How Automated Revenue Tracking Improves Retention Insights for more ways to align finance and customer success teams.