Blog

  • SaaS Finance Dashboard Real-Time Metrics Without Spreadsheets

    SaaS Finance Dashboard Real-Time Metrics Without Spreadsheets

    If you’re running a SaaS business, your financial data moves fast—new signups, churn, upgrades, and expenses all shift in real time. A SaaS finance dashboard helps you make sense of that constant motion without waiting for end-of-month reports or juggling untrustworthy spreadsheets. In this post, we’ll explain what a modern finance dashboard should include, why spreadsheets and basic BI tools fall short, and how integrated platforms like MainFoundry deliver live MRR, ARR, and expense insights for faster, data-driven decisions.

    What a Modern SaaS Finance Dashboard Should Show

    A finance dashboard is only as good as its data freshness. Traditional spreadsheets and static reports may look organized, but they hide timing issues and outdated inputs. A modern SaaS finance dashboard must present live, connected data flowing directly from billing, CRM, and operational sources.

    At its core, this kind of dashboard delivers instant visibility into recurring revenue. Real-time MRR and ARR calculations automatically adjust as customers upgrade, downgrade, or churn, giving leaders true cash flow clarity. When tied into customer records within a unified CRM system like MainFoundry’s unified CRM and finance platform, revenue insights stay grounded in actual customer behavior rather than abstract trends.

    Beyond simple totals, you also need clarity around *where* revenue comes from and *how* it changes over time. Segmenting results by plan, cohort, or customer type reveals growth dynamics, helping you pinpoint promising segments or emerging risks. When linked with marketing analytics and attribution, these insights turn into actionable strategies instead of just metrics.

    Equally essential is churn analysis. A live dashboard should constantly monitor retention, renewals, and churn—far before renewal periods—so teams can identify problems proactively. Linking churn data to CRM activities or onboarding histories highlights patterns early and quantifies the ARR impact before issues escalate.

    Modern dashboards also unify expense tracking and burn rate monitoring. In platforms like MainFoundry’s subscription and billing management environment, expenses, invoices, and receivables appear side by side. This single view highlights rising costs, provides real cash flow context, and ensures burn rate updates with every payment or revenue shift—yielding an accurate real-time runway assessment.

    “A real-time SaaS finance dashboard transforms finance from a reporting function into a fast-moving operational driver.”

    Why SaaS Teams Move Beyond Spreadsheets and BI Tools

    Familiar as they may be, spreadsheets create friction. They demand manual updates, carry risk from fragile formulas, and rarely sync perfectly across systems. Even the best-designed spreadsheet dashboard is outdated within hours. Similarly, standalone BI tools visualize data nicely but still depend on disconnected sources and constant upkeep.

    A truly effective SaaS finance dashboard lives within the same system that powers subscriptions, billing, and CRM. This is where MainFoundry stands out—by combining core financial and operational data into one connected platform. Data flows automatically from every billing event or invoice update, forming a single version of financial truth instead of many inconsistent reports.

    Customization also matters. Executives might focus on ARR and burn rate, while finance teams zero in on cash flow or expense patterns. With custom workspaces for finance and operations, dashboards adapt to these roles without splitting data sources or compromising accuracy.

    Automation and AI-driven finance insights now redefine how teams work with data. Instead of manually pulling or merging reports, AI systems like MainFoundry’s AI platform can surface patterns—such as growing churn or rising burn rates—before they become serious issues. These capabilities free teams to focus on strategy rather than spreadsheet maintenance.

    Pro Tip: Build dashboards inside the same tools that power your revenue and billing operations. This ensures your financial metrics always reflect reality—not last week’s exports.

    Key Takeaways

    • A modern SaaS finance dashboard delivers real-time MRR, ARR, churn, and expense tracking linked directly to operational systems.
    • Integrating finance and CRM data transforms reporting into a proactive growth tool rather than a backwards-looking summary.
    • Spreadsheets and legacy BI tools lag behind—automation and integration offer speed, trust, and precision.
    • Platforms like MainFoundry unite billing, CRM, and financial data into one real-time source of truth for faster decision-making.

    Next Steps

    If your reporting still depends on exports and manual reconciliation, it’s time for a change. Explore MainFoundry to see how connected finance, CRM, and analytics can deliver clarity without complexity.

  • SaaS Financial Reporting Mistakes That Hurt Growth

    SaaS Financial Reporting Mistakes That Hurt Growth

    Financial reporting failures in SaaS don’t happen overnight—they grow quietly in spreadsheets and inconsistent data as startups chase speed over structure. Before long, what looked “good enough” becomes a liability. This post explores why SaaS companies fail at financial reporting, highlighting the early missteps that distort performance and create turbulence during growth. You’ll learn how small accounting inconsistencies lead to big problems, and how structured systems help SaaS teams build reporting that scales with clarity and confidence.

    The hidden setup: why SaaS financial reporting goes wrong early

    In the early stages of a SaaS business, financial hygiene often takes a back seat to growth. Founders prioritize launching features and signing customers, assuming they can “clean up the books” later. But SaaS financials are unique—subscription revenue, deferred income, renewals, upgrades, and lifetime value must be tracked systematically for decisions to be sound. When these details aren’t managed consistently, founders end up steering with distorted data, and investors quickly lose confidence.

    Most financial reporting breakdowns stem from recurring mistakes: blending cash and accrual accounting, mishandling deferred revenue, and misclassifying expenses. Each alone might seem manageable, but together they create statements no one fully trusts. When deferred revenue is recognized too early, growth looks inflated and churn invisible—until sudden revenue drops expose the truth. Inconsistency between subscription data, billing tools, and financials compounds the confusion and makes audits painful.

    “SaaS reporting failures rarely come from complexity—they come from inconsistency.”

    Building structured systems that scale with your SaaS

    Preventing future reporting chaos starts with consistent accrual-based accounting. Each contract should follow the same revenue recognition logic, updating automatically as customers renew or upgrade. Deferred revenue schedules must be tied to actual service delivery—not cash in the bank. This ensures your financial statements keep their internal logic even as transaction volume grows and business models evolve.

    Equally critical is aligning operational metrics like MRR, ARR, churn, and expansion revenue with your financial system. Many SaaS teams track these metrics in isolated dashboards, disconnected from accounting data. When both metrics and financials pull from the same structured foundation, you gain a single version of truth. Platforms such as MainFoundry’s finance management tools make this integration seamless, ensuring deferred revenue and invoicing remain in sync from the start.

    A clean chart of accounts and department-level expense tracking are equally important for clarity. They make metrics like gross margin and burn rate instantly visible, not buried in manual reports. With custom workspaces and flexible data models, teams can connect financial and operational insights without rigid templates. And by linking CRM and finance data directly through MainFoundry’s unified CRM integration, you can finally connect revenue to customers, contracts, and lifecycle stages—all in one consistent system.

    Pro Tip: Invest in connected financial infrastructure early—fixing reporting when it breaks later costs exponentially more than building it right from day one.

    Key Takeaways

    • SaaS reporting issues begin early, caused by unstructured data and mixed accounting methods.
    • Deferred revenue mismanagement inflates short-term performance while hiding churn and risk.
    • Consistent accrual accounting and integrated systems create reliable, scalable financial visibility.
    • Platforms like MainFoundry align subscriptions, billing, and CRM data to maintain a single source of truth.
    • If your reports feel fragile, revisit your foundation—accuracy and consistency are the ultimate growth assets.

    Related Reading

    Discover how modern SaaS firms automate revenue recognition in MainFoundry’s billing and subscription insights.

  • SaaS Metrics Benchmarks 2026 for Every Growth Stage

    SaaS Metrics Benchmarks 2026 for Every Growth Stage

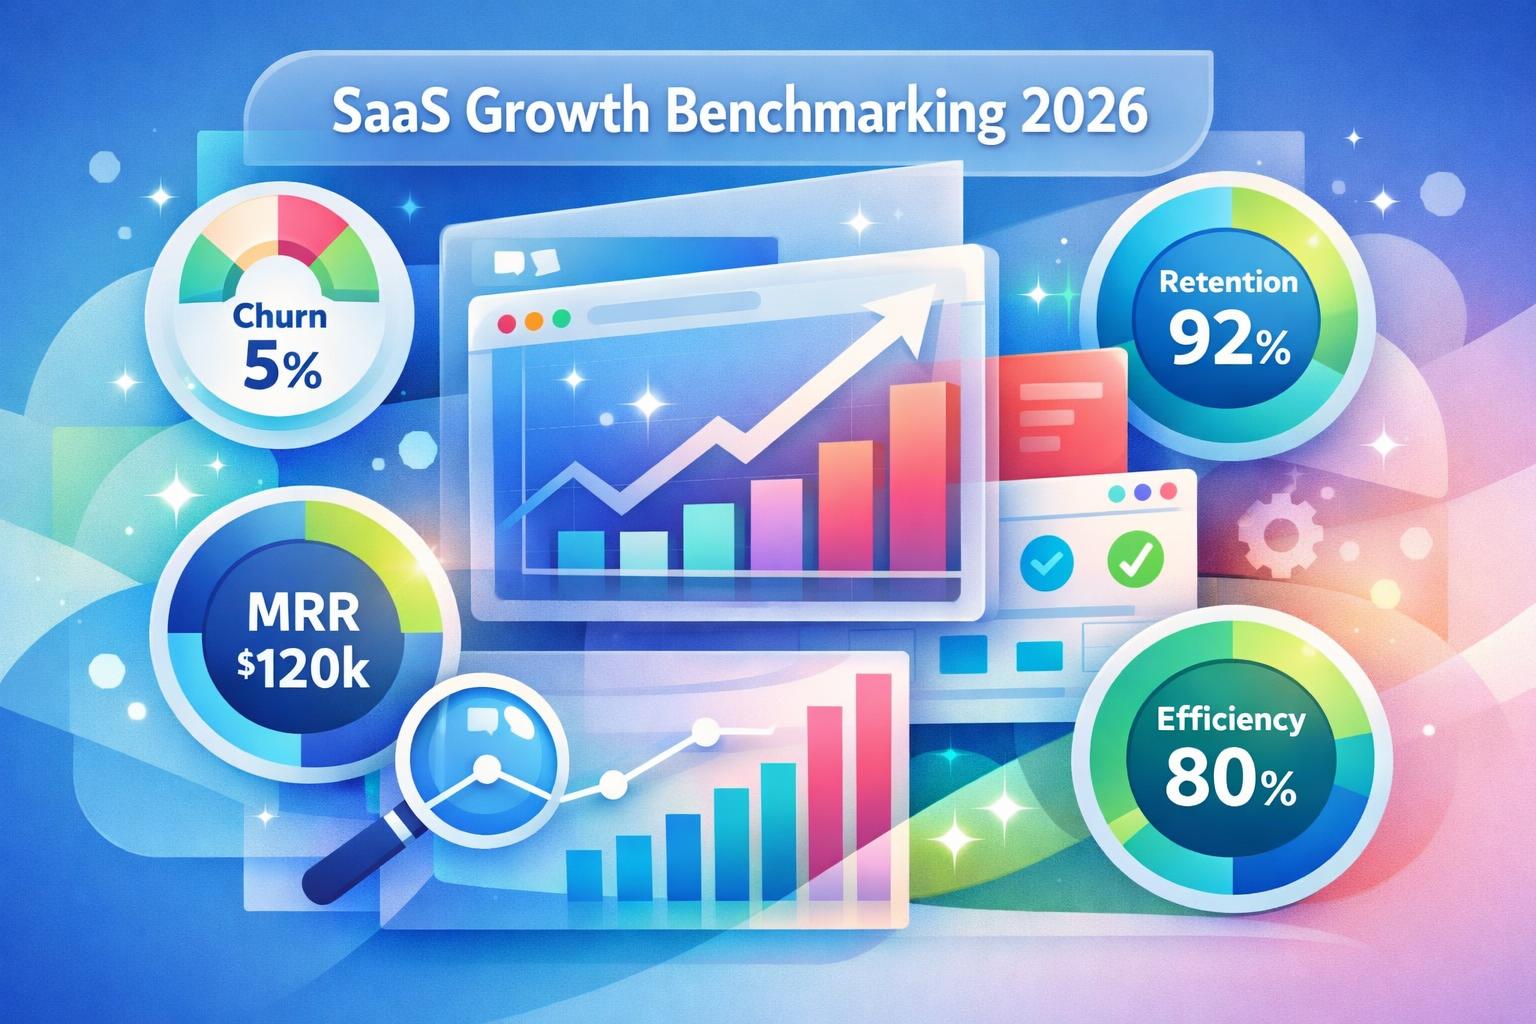
    If you’re scaling a SaaS company in 2026, you’ve likely realized that today’s performance standards look very different from the hypergrowth era of years past. The landscape has matured, capital efficiency matters more than ever, and investors want to see sustainable growth rather than short-term spikes. This post unpacks the latest SaaS metrics benchmarks 2026—covering MRR growth, churn, retention, LTV:CAC, and margins—organized by company stage. You’ll learn what healthy performance looks like now, how to diagnose red flags early, and how unified finance tools like MainFoundry help founders stay ahead of the curve.

    How SaaS Benchmarks Shift by Stage

    In 2026, SaaS growth has normalized into a world where sustainability beats spectacle. Between $1M and $30M in ARR, most companies grow around 25% annually, while top performers hit 40–50%. The wild years of universal 60%+ expansion are behind us. For seed startups, uneven growth is typical—stability and validation matter more than flashy percentages. Series A businesses aim to prove repeatable demand, while Series B+ companies increasingly drive expansion from existing customers rather than constant acquisition.

    Accurate tracking means understanding where growth originates—new customers, upgrades, or reactivations—and how durable it is. With MainFoundry’s subscription and billing management, founders gain clarity on revenue composition, identifying which streams are repeatable versus one-offs. This stage-by-stage transparency turns raw MRR growth into actionable insight.

    “In 2026, durability—not velocity—is the ultimate growth benchmark for SaaS companies.”

    Similarly, churn continues to constrain true scale. A monthly churn below 1% (roughly 5% annually) still defines healthy retention, while top-tier B2B players push even lower. Early-stage founders often miss the warning signs because small sample sizes can disguise weaknesses in onboarding or product stickiness. By Series A, retention becomes a credibility test—strong unit economics start with customers who stay. Platforms like MainFoundry’s integrated CRM and finance tools connect churn data to deal metrics, illuminating the “why” behind every lost account.

    Retention, Efficiency, and the Economics of Growth

    Across modern B2B SaaS, net revenue retention (NRR) just above 100% is now the median benchmark. The best-performing companies exceed 120%, driven by usage-based expansion and upsells. While seed-stage businesses often hover near break-even retention, Series A teams cross 105% as they find product-market fit and pricing discipline. At Series B+, anything below 110% can trigger investor concern about scalability and expansion efficiency.

    Strong retention compounds growth. Companies with healthy NRR can grow faster on the same marketing spend, making it more important than raw customer count. With MainFoundry’s real-time revenue metrics, founders monitor retention continuously instead of waiting for board decks to reveal surprises.

    Pro Tip: Review NRR and MRR growth together—high retention can mask slowing acquisition, while high growth can hide churn risk. Assess both side by side for a complete efficiency picture.

    The LTV:CAC ratio remains a litmus test for lasting profitability. A minimum of 3:1 is standard, while 4:1 indicates elite operational health. Early-stage calculations often mislead due to variable sales inputs, but by Series A and beyond, accurate CAC measurement—and roughly one-year payback periods—signal maturity. MainFoundry’s unified finance management tools ensure founders ground these ratios in verifiable data rather than optimistic projections.

    Finally, gross margin remains the stabilizing force beneath every metric. In 2026, top SaaS companies still record margins in the high‑70% to mid‑80% range, with improvements yielding direct gains in valuation. Sub‑70% margins often reveal structural inefficiencies—overreliance on services, infrastructure waste, or fragmented systems. MainFoundry’s unified cost attribution helps teams pinpoint exactly where margin improvement efforts should focus.

    Companies with NRR above 110% reduce their pressure on acquisition and grow nearly twice as fast over time.

    Key Takeaways

    • In 2026, efficient growth has replaced hypergrowth as the defining SaaS objective.
    • Median growth sits around 25%, with churn below 1% and NRR over 110% key to resilience.
    • Healthy LTV:CAC ratios (3:1 or higher) and margins above 75% remain cornerstones of scalable profitability.
    • Visibility across revenue, churn, and cost data enables proactive decisions before inefficiencies compound.
    • Founders can streamline benchmarking with unified tools like MainFoundry, turning financial insight into action.

    Related Reading

    Explore our deep-dive on SaaS billing efficiency to understand how integrated revenue systems can further improve your metric accuracy.

  • How to Reduce SaaS Churn With CRM-Driven Signals

    How to Reduce SaaS Churn With CRM-Driven Signals

    Reducing churn is one of those persistent challenges every SaaS team faces but few truly master. When growth slows or cancellations outweigh expansions, it’s often a sign that disengagement has begun. This practical guide breaks down a data-driven approach to lowering SaaS churn by identifying risk early, improving onboarding, building reliable health scores, and streamlining payment recovery. You’ll learn how connected systems can help your team act before customers walk away—and how platforms like MainFoundry make proactive retention the standard, not the exception.

    Identify Churn Risk Before It’s Too Late

    Most churn doesn’t happen suddenly—it builds quietly as signals accumulate. Customers use fewer features, log in less often, or let billing warnings slip by. The challenge for SaaS teams is connecting these dots early enough to make a difference. When usage data, billing alerts, and communications live in separate tools, these patterns remain invisible until it’s too late.

    To catch churn risk early, look for behavioral shifts rather than formal cancellations. For instance, a sharp drop in login frequency or feature adoption signals unmet expectations. When CRM data and engagement tracking are unified, subtle trends become obvious—like a once-active account that suddenly goes silent for two weeks. This context empowers your success team to respond before frustration sets in.

    Platforms such as MainFoundry enable these insights by linking every customer interaction—emails, meetings, activity, and billing—within one timeline. Instead of pulling fragmented reports, teams can visualize how engagement evolves across accounts. From there, building effective customer health scores transforms patterns into practical action. A missed payment paired with declining usage becomes a clear signal to step in, rather than two isolated data points lost across systems.

    “Early visibility changes the tone of customer conversations—from reactive damage control to proactive partnership.”

    Build a Churn Reduction System That Scales

    Once you can spot warning signs early, the next step is acting systematically. A strong churn prevention framework combines three engines: onboarding, health scoring, and payment management. Each supports retention from first login to renewal, reinforcing customer confidence at every stage.

    Successful onboarding delivers value fast. Instead of showcasing every feature, drive customers toward one activation milestone—their first “aha” moment. Monitor progress over the initial weeks. If users stall, proactively offer guidance or walkthroughs to remove friction. Feedback during this phase often exposes fixable issues that cause long-term churn if ignored.

    Customer health scores extend this mindset through the entire lifecycle. A dynamic score reflecting usage depth, support history, and billing reliability gives teams a clear prioritization map. With MainFoundry’s custom workspaces, you can design workflows that trigger alerts or tasks when health dips—turning metrics into real-time action.

    Pro Tip: Automate outreach when a combination of low usage and billing alerts appear—these blended signals predict churn far more accurately than isolated metrics.

    Then there’s involuntary churn—accounts lost to expired credit cards or failed transactions. Even the best success strategy falters if payment recovery is ignored. Smart billing flows that provide gentle reminders, retry logic, or subscription pause options can reclaim significant revenue while keeping relationships intact. When subscription management and CRM data connect, outreach becomes informed and empathetic instead of transactional.

    • Define one activation milestone and track progress during onboarding
    • Build dynamic health scores with real data like usage and billing stability
    • Automate tasks or messaging when risk signals trigger
    • Recover failed payments through customer-friendly workflows

    Key Takeaways

    Reducing churn hinges on visibility and connected data. Teams that effectively tackle how to reduce SaaS churn don’t rely on last-minute interventions—they detect problems before they grow. Focus first on understanding where customer signals live and begin unifying them. Treat onboarding as the foundation of retention, use health scores to guide structured outreach, and protect your bottom line through smart payment recovery.

    If your team is ready for a unified approach, MainFoundry offers one workspace for CRM, engagement data, and billing visibility. That connected ecosystem doesn’t just prevent churn—it builds trust through timely, context-driven action. Start by reviewing where your data is fragmented, then connect the dots that matter most. Sustainable retention begins with clarity and consistency.

    Related Reading

    Explore How to Create Effective SaaS Health Scores for deeper insights into risk prediction models.

  • SaaS Financial Dashboard Metrics That Drive Decisions

    SaaS Financial Dashboard Metrics That Drive Decisions

    A strong SaaS financial dashboard isn’t just a spreadsheet turned visual—it’s your daily compass for understanding growth, efficiency, and risk. Too often, these dashboards overwhelm rather than inform, leaving founders scrambling for clarity. This guide shows you how to build a SaaS financial dashboard that actually scales, supports real decisions, and stays trusted over time. You’ll learn which key metrics matter most, how to visualize them effectively, and how to keep your data fresh without manual effort.

    Designing a SaaS Financial Dashboard That Drives Real Decisions

    When most teams attempt to build dashboards, they fall into a familiar trap—displaying every chart imaginable. The result is a beautiful but useless dashboard that no one checks. Many fail because metrics are old, figures don’t align with accounting, or users simply don’t trust what they see. In SaaS, where **recurring revenue**, churn, and **customer acquisition costs** behave differently from one-time sales metrics, clarity is everything.

    To build something teams actually use, start with a small, reliable set of indicators anchored in consistent data. Focus on questions decision-makers care about: Are we growing? Is that growth sustainable? Can current cash support our next stage? By narrowing metrics down to the essentials and pulling data from connected sources, your dashboard becomes actionable rather than ornamental.

    “A useful SaaS dashboard doesn’t track everything—it tracks what drives decisions.”

    Integrated systems make this discipline feasible. When your revenue lives in one tool, expenses in another, and subscriptions in a third, reconciling core metrics like LTV or CAC becomes slow and error-prone. Tools such as MainFoundry solve this by natively connecting billing, revenue metrics, and expense tracking into a unified financial view. Their finance management dashboard keeps metrics consistent and instantly usable across teams.

    The Metrics and Visual Practices That Make Dashboards Work

    The foundation of your dashboard should be clear, comparable metrics that define financial health. The most valuable ones—such as **Monthly Recurring Revenue (MRR)**, **Churn rate**, **Lifetime Value (LTV)**, **Customer Acquisition Cost (CAC)**, and **Runway**—offer signal rather than noise. Around these, you can include supporting context like ARR, average revenue per account, operating expenses, and cash flow. The fewer, the better.

    • Focus on five to seven key performance indicators that reflect both growth and sustainability.
    • Ensure data consistency by syncing metrics directly from your billing, CRM, and accounting systems.
    • Visualize trends with line charts and comparisons with clear, unobtrusive color schemes.

    Visualization should be about comprehension, not decoration. Time-based charts like MRR trends or churn should use simple line graphs, while comparisons such as LTV vs. CAC are easier to digest through clean bar formats. Minimalism wins—dashboards loaded with filters and dense colors slow reactions. MainFoundry’s custom workspaces add flexibility by tying financial entries to customers or projects, maintaining context without clutter.

    Pro Tip: Match update cadence to data volatility—cash and revenue may update daily, while LTV and CAC often work best on a weekly or monthly basis.

    Avoid manual refreshes whenever possible. Automation through direct integrations keeps dashboards accurate and timely. For instance, MainFoundry syncs CRM, marketing attribution (/marketing/), and financial data so decision-makers always see the latest metrics without extra work.

    Key Takeaways

    Building a scalable SaaS financial dashboard is about focus and trust. Start with metrics that genuinely reflect performance—MRR, churn, LTV, CAC, and runway—and map them to authoritative data sources. Keep your visuals simple enough to scan in minutes and automate updates so accuracy never depends on manual effort. Finally, revisit your dashboard quarterly to realign it with evolving business goals and stages of growth. For teams seeking an integrated approach, MainFoundry unites finance, CRM, and analytics into one cohesive platform—helping your dashboard grow as your business scales.

    Related Reading

    Explore how AI-driven financial insights can further streamline your SaaS decision-making.

  • How to Calculate SaaS CAC Using CRM Data

    How to Calculate SaaS CAC Using CRM Data

    Understanding how to calculate CAC for SaaS accurately can make or break your growth strategy. This metric reveals what you truly spend to win each new customer and determines whether your acquisition efforts are sustainable in the long run. In this guide, you’ll learn the correct step-by-step approach, when to use blended versus channel-specific CAC, and how to benchmark effectively for different business stages. You’ll also discover how platforms like MainFoundry unify your data to make CAC a truly operational metric instead of just a spreadsheet number.

    How to Calculate CAC for SaaS the Right Way

    At its core, customer acquisition cost (CAC) represents the average expense of acquiring one paying customer over a given time frame. Although the formula is simple, the preparation behind it matters. Before calculating, select a time period that accurately reflects your sales cycle. If conversions take several months, align today’s customer numbers with your prior marketing and sales expenditure for realistic results.

    Once you’ve chosen the right timeframe, gather every cost connected to acquisition—paid ads, campaign budgets, team salaries, commissions, software subscriptions, and consultant fees. Avoid mixing unrelated expenses like product development or support for existing clients. When you have the total acquisition cost and the count of new paying customers, dividing one by the other yields your CAC. For instance, if you spent $20,000 and acquired 50 new users, your CAC equals $400.

    “Accurate CAC depends on complete, connected data across marketing spend, sales activity, and customer acquisition records.”

    Many teams struggle with fragmented systems—marketing spends tracked separately from sales or customer data. A unified CRM and marketing platform like MainFoundry solves this by connecting campaign performance, conversion tracking, and closed deals, letting you calculate CAC with true precision.

    Blended vs. Channel-Specific CAC: Choosing the Right Approach

    Once you can compute overall CAC, decide which version helps most with your analysis. Blended CAC consolidates all acquisition costs into one figure, offering a broad efficiency snapshot perfect for investor reports or financial planning. However, it masks individual channel performance—strong organic results might conceal underperforming paid campaigns.

    In contrast, channel-specific CAC breaks down spending by sources like paid search, content marketing, or outbound sales. With this view, teams identify which channels deliver customers most efficiently and refine budgets accordingly. Reliable channel-level CAC hinges on accurate attribution—tracking each campaign through UTM data, lead conversion, and revenue outcomes. Marketing attribution tools within MainFoundry link campaigns to actual customer revenue, replacing guesswork with clarity.

    A healthy SaaS business targets an LTV-to-CAC ratio of at least 3:1—efficient growth hinges on maintaining that balance.

    Keep in mind that CAC benchmarks differ across SaaS stages. Early ventures may experience higher costs while experimenting with acquisition tactics. Mature businesses improve ratios as their brand recognition grows. Instead of chasing an arbitrary number, track trends—monitor whether CAC falls as performance improves or rises due to inefficient channels.

    Key Takeaways

    • CAC is straightforward to calculate but only meaningful with clean, connected data.
    • Align your measurement period with actual conversion timelines for accuracy.
    • Use blended CAC for executives and channel-specific CAC for optimization decisions.
    • Track your LTV-to-CAC ratio and watch trends rather than isolated metrics.
    • Integrating marketing, CRM, and financial data—such as with MainFoundry—turns CAC into an actionable metric across your entire SaaS operation.

    Related Reading

    Check out Understanding LTV for SaaS Growth for deeper insight into balancing acquisition costs with customer lifetime value.

  • How to Calculate CAC for SaaS Step-by-Step Guide

    How to Calculate CAC for SaaS Step-by-Step Guide

    Understanding how to calculate CAC for SaaS is essential for every subscription-based business. While it may seem like simple math, this metric influences everything from pricing and growth targets to hiring and fundraising. However, without disciplined tracking and consistent definitions, CAC can easily mislead decision-making. This guide breaks down the process step by step, exploring what costs to include, how to avoid common mistakes, and how to interpret blended versus channel‑specific CAC. It also highlights best practices and benchmarks for SaaS companies at different stages of growth.

    How to Calculate CAC for SaaS the Right Way

    At its core, customer acquisition cost (CAC) measures how much your SaaS company spends to bring in a new paying customer within a defined period. The formula is straightforward—total acquisition costs divided by the number of new customers gained—but accuracy depends on consistency and clean data alignment.

    Start by setting a fixed time frame, such as a month or quarter, and ensure that both spending and customer counts come from the same period. Mixing different windows, like using three months of spend and one month of new customers, leads to distorted results. Then total the costs that directly contribute to acquiring new customers, including marketing expenses, sales compensation, commissions, acquisition tools, and onboarding resources specific to new accounts.

    After identifying acquisition costs, tally the number of new paying customers obtained in that same period. In SaaS, this usually excludes free trials or prospects that have not converted. Aligning acquisition spend with actual conversions creates a much more realistic view of efficiency. Finally, divide total acquisition spend by the number of new customers. The resulting figure is your CAC for that time period—an indicator of how much your growth truly costs.

    “CAC is only as reliable as the data and consistency behind the calculation—mixing periods or excluding key costs can completely distort reality.”

    For example, imagine a SaaS business that spends across ads, sales salaries, commissions, and tools in one quarter and gains a few hundred new paying customers. Dividing total spend by those new customers yields a CAC that reflects the true cost of growth, not just advertising performance. This kind of precision becomes easier when systems communicate. Platforms that connect marketing analytics and attribution with CRM data—such as MainFoundry—simplify this process by linking spend directly to outcomes.

    Blended vs Channel‑Specific CAC and Realistic Benchmarks

    Once you understand the basics of the CAC formula, digging into blended versus channel‑specific CAC provides deeper insights. Blended CAC combines total acquisition spending across all channels and divides it by all new customers, giving you an overall measure of efficiency. Investors and executives often use it to gauge sustainable growth. In contrast, channel‑specific CAC isolates performance by channel—paid search, partnerships, outbound sales, and more—to identify which tactics yield the highest return.

    Blended CAC shapes top‑level strategies such as pricing and scaling, while channel CAC uncovers where to optimize resources. For example, if content marketing drives strong conversions at lower cost, reallocating spend from less efficient paid campaigns can improve overall unit economics. However, accurate channel measurement requires robust data connection across campaigns, CRM, and billing systems. Integrating CRM contact management and marketing attribution tools ensures channel data aligns with actual conversions.

    Benchmarks vary by company stage. Early SaaS ventures often face higher CAC while validating channels and building awareness. Growth‑stage teams prioritize efficiency and aim to shorten payback periods. Mature businesses focus on maintaining predictable CAC aligned with recurring revenue. Many compare CAC to lifetime value (LTV), targeting a multiple of several times higher to maintain sustainable growth. If CAC grows faster than customer value, it signals fragility no matter how strong top‑line numbers appear.

    Pro Tip: Assess CAC alongside payback period and revenue retention. Even high LTV can strain finances if acquisition costs take too long to recover.

    Excluding unrelated costs is equally vital. Product development, retention initiatives, and company‑wide overhead should not inflate your CAC. Keeping the metric pure ensures it reflects only acquisition performance. MainFoundry’s subscription and billing management features help unify acquisition and revenue data, enabling finance teams to track payback periods with accuracy.

    Key Takeaways

    • Define consistent time frames and clear acquisition cost criteria to ensure accurate CAC.
    • Use blended CAC for strategic insight and channel‑specific CAC for tactical optimization.
    • Focus on trends and ratios—especially CAC to lifetime value—rather than isolated numbers.
    • Integrate marketing, CRM, and billing data to make CAC a living, actionable metric.
    • Streamline your data architecture with unified platforms like MainFoundry to connect acquisition costs and revenues efficiently.

    Related Reading

    Learn more about aligning acquisition and retention metrics in How to Measure LTV for SaaS: A Practical Framework.

  • SaaS Burn Rate Guide for Runway and Growth Decisions

    SaaS Burn Rate Guide for Runway and Growth Decisions

    Every SaaS founder eventually faces the question: how long can we keep burning cash before we need more? Understanding your burn rate isn’t just about survival—it’s about confidence in your growth trajectory and strategic decision-making. This guide unpacks what burn rate really means, how to calculate runway accurately, and when your spending patterns signal danger. You’ll also learn how to align burn with growth goals and use financial visibility to make smarter, faster decisions for your business.

    What Burn Rate Means for SaaS Companies

    When people talk about burn rate, they’re usually referring to how much money their company loses each month. But in SaaS, there are two specific metrics that reveal different sides of your financial health—gross burn and net burn. Gross burn tracks your company’s total monthly spending, from salaries and infrastructure to marketing and operations. It shows how expensive your business is to run, regardless of incoming cash.

    Net burn, however, subtracts your monthly revenue from that outflow to show how much cash the business is actually losing. If your team spends $100,000 and earns $60,000 in recurring revenue, your net burn is $40,000. That $40k figure is what investors and founders focus on most when assessing how quickly the company depletes its cash reserves. Once a SaaS company becomes cash-flow positive, burn rate takes a backseat to profitability and free cash flow.

    “A rising net burn without corresponding revenue growth is often the first red flag that your spending isn’t translating into traction.”

    Tracking both burn types provides context: a high gross burn might be fine if revenue is scaling, but an increasing net burn without acceleration signals inefficiency. For founders, this balance becomes a north star when deciding whether to hire, raise capital, or adjust spend. Real financial clarity—especially through a connected platform like MainFoundry’s subscription and billing management dashboard—makes it easier to stay proactive rather than reactive.

    Calculating Burn Rate, Runway, and Identifying Warning Signs

    Calculating burn rate isn’t complicated—accuracy comes down to the quality of your data. Gross burn is usually the average monthly outflow over several months, adjusted for one-time anomalies. Net burn can be measured by subtracting average revenue from gross burn, or by observing how your total cash balance decreases month over month. From there, divide your current cash balance by net burn to estimate your months of runway. For instance, if you hold $1 million in cash and burn $50,000 per month, you have about 20 months to operate.

    Runway is dynamic—it changes as hiring, churn, and pricing evolve. That’s why founders should revisit it regularly, not quarterly. Using tools that connect expense data and subscription revenue simplifies this process, removing reliance on manual spreadsheets. MainFoundry integrates these components into one finance interface, offering real-time burn and runway visibility.

    • Net burn is rising while revenue growth stalls—spending isn’t converting into results.
    • Runway drops below 12–18 months without a clear capital or profitability strategy.
    • Gross burn increases from fixed costs, reducing flexibility to adapt when market conditions shift.

    When these patterns emerge, focus on diagnosing the drivers—like longer sales cycles, rising churn, or weak ROI in paid acquisition. Burn rate points to the pressure; integrated analytics reveal the root causes. By linking marketing attribution and finance data, founders can connect spend directly to growth performance rather than reacting after the fact.

    Pro Tip: Review your burn and runway every month, not every quarter—small adjustments now can extend your operational timeline by months without drastic cuts.

    Key Takeaways

    Burn rate is more than a survival metric—it’s a strategic compass that helps SaaS founders evaluate spending against growth. Track both gross and net burn to understand your cost structure and true cash outflow. Calculate and revisit runway frequently to align operational plans with financial realities. Recognize early when burn rises without matching progress, and use connected financial tools to correlate spending decisions with outcomes. The goal isn’t eliminating burn—it’s making every dollar spent drive meaningful progress toward scale and profitability.

    Related Reading

    Explore how MainFoundry integrates subscriptions, expenses, and analytics to make burn management part of everyday strategy, or reach out directly at MainFoundry Contact.

  • SaaS Unit Economics Metrics Every Leader Should Track

    SaaS Unit Economics Metrics Every Leader Should Track

    In fast-growing subscription businesses, understanding SaaS unit economics can make the difference between scaling sustainably and burning cash. These metrics reveal whether each new customer is creating real value or simply adding cost. In this post, we’ll break down the essentials—Customer Acquisition Cost (CAC), Lifetime Value (LTV), payback period, and gross margin—and explore how they connect to give a full picture of financial health. You’ll also see how platforms like MainFoundry simplify tracking these metrics so you can make smarter, data-backed decisions as you grow.

    Core SaaS Unit Economics Metrics and How They Interconnect

    At first glance, SaaS models seem straightforward: revenue recurs, costs appear predictable, and growth feels linear. However, unit economics reveal what’s truly happening beneath the surface by tying customer acquisition, retention, and margins together. When you measure the right metrics, you can quickly diagnose whether your growth is profitable or precarious.

    The first key measure is Customer Acquisition Cost (CAC)—the sum of all marketing and sales expenses needed to win a new customer. This includes ad spend, commissions, and less visible inputs like salaries or software costs. If CAC rises faster than customer value, growth becomes unsustainable, often visible only after cash burn accelerates.

    Next, Lifetime Value (LTV) represents how much total revenue a customer generates over the duration of their relationship. In SaaS, LTV is driven by retention and average revenue per account. The longer customers stay—and the more they expand contracts—the higher the lifetime value. Product quality and customer success efforts silently power this metric as much as your marketing spend does.

    The LTV-to-CAC ratio shows whether customer acquisition returns are healthy. A benchmark ratio above 3:1 is often considered strong; falling below suggests acquisition inefficiency, high churn, or misaligned pricing. Complementing this, the payback period adds a time factor—how quickly gross profit covers CAC. Faster recovery improves cash flow and lowers risk, with many SaaS leaders aiming for a one-year or shorter payback horizon.

    Finally, gross margin measures how much of each dollar of revenue remains after direct delivery costs like hosting or support. High margins amplify LTV and shorten payback, while declining margins signal cost structure issues that can undermine profitability even when sales are strong. Together, these metrics form a financial ecosystem—each one influencing the others to determine long-term viability.

    “SaaS unit economics aren’t a checklist—they’re a connected system where churn, pricing, and cost efficiency move together to determine success.”

    Using SaaS Unit Economics to Guide Smarter Decisions

    Once you understand the numbers, the power of SaaS unit economics lies in using them to drive real decisions. Subtle differences across customer segments can reveal big strategic insights—for instance, if two segments share similar CAC but one expands over time, that segment offers higher LTV and faster payback, making it a stronger investment target.

    Gross margin analysis also informs product and pricing strategy. Features that boost usage but rely on costly infrastructure can reduce margin if not priced correctly. By connecting margin data with retention and expansion metrics, you can decide whether to optimize costs, adjust pricing, or reposition a feature. The insights compound when viewed in integrated dashboards like MainFoundry’s finance management dashboard, which centralizes billing and expense data.

    With unified data from tools like CRM integrations and operational workspaces, teams can align around live metrics instead of disconnected reports. Sales tracks CAC, finance monitors cash recovery, and product teams own retention—all through shared dashboards showing real-time performance trends. This transparency turns reactive analysis into proactive management.

    Pro Tip: Track margin, payback, and retention trends together each month. They reveal early signals of churn, pricing issues, or over-investment before the financial impact becomes visible.

    Ultimately, SaaS unit economics are less about hitting exact benchmarks and more about seeing direction and consistency. Improving margins, shortening payback, or expanding LTV faster than CAC all point toward scalable, sustainable growth. When metrics improve together, your business creates more value per customer—and scaling becomes far less stressful.

    Key Takeaways

    • SaaS unit economics act as a connected system—changes in CAC, LTV, payback, or margin ripple across others.
    • Retention and expansion often grow LTV more efficiently than lowering acquisition costs.
    • Shorter payback periods strengthen cash flow and reduce scaling risk.
    • Healthy gross margins fuel reinvestment and accelerate growth.
    • Centralized dashboards like those in MainFoundry enable real-time insight into evolving unit economics.

    Related Reading

    Explore how integrated financial tracking can transform your SaaS decision-making at MainFoundry.com.

  • Net Revenue Retention Formula and SaaS Benchmarks

    Net Revenue Retention Formula and SaaS Benchmarks

    When you’re building a SaaS business, few metrics tell the story as clearly as net revenue retention (NRR). It quietly reveals whether your existing customers are deepening their investment in your product—or slipping away. For founders, it’s a mirror; for investors, it’s a predictor of long-term growth. This post breaks down what NRR actually measures, how to calculate it, why investors value it so highly, and how platforms like MainFoundry’s billing and subscription tools make tracking it much easier.

    What Net Revenue Retention Actually Measures

    Unlike customer retention, which focuses purely on how many customers you keep, net revenue retention looks at how much recurring revenue you retain from those customers over time. Think of it as a financial pulse of your existing customer base—capturing the expansions, contractions, and churn that drive your business forward or backward.

    If every new sale stopped tomorrow, NRR answers the question, “would my existing revenue base grow or shrink?” Upsells, seat expansions, and price increases push the number higher, while cancellations and downgrades pull it down. When the ratio sits above 100%, your expansion revenue more than compensates for losses—a clear sign that customers are gaining value and deepening engagement.

    NRR = (Starting MRR + Expansion – Contraction – Churn) / Starting MRR × 100%

    The math is simple, but the data challenges are not. Keeping track of every upgrade, downgrade, and cancellation accurately requires clean subscription data. That’s why teams use unified systems like MainFoundry’s subscription and billing management to make this easier and more reliable than cobbling together spreadsheets.

    “NRR doesn’t just measure revenue—it measures the strength of your relationship with existing customers.”

    Why Investors Obsess Over Net Revenue Retention

    From an investor’s perspective, a high NRR is one of the strongest indicators of growth durability. When existing customers continue expanding their spend, it shows your product is integral to their success—reducing reliance on constant new customer acquisition. This kind of growth compounds over time and makes your company more predictable and valuable.

    Strong NRR means new revenue layers on top of a stable base, even when sales cycles slow down. It directly impacts valuation, with investors typically rewarding SaaS businesses that maintain NRR above 110% with premium revenue multiples. That’s because expansion revenue is lower-cost, easier to sustain, and signals enduring customer satisfaction.

    The best public SaaS companies often achieve NRR above 120%, proving that expansion drives world-class retention.

    Benchmarks naturally shift based on company stage. Early startups might fluctuate between 80–100% as they refine their pricing and onboarding. Growth-stage SaaS teams push past 100% with consistent upsells, while mature leaders in public markets exceed 110%. Breaking that 100% threshold signals your product can sustain growth organically.

    To manage NRR effectively, you need more than billing data. Connecting revenue performance to how customers actually use your product reveals the “why” behind expansions and contractions. Tools like MainFoundry’s CRM integration and custom workspaces bring this view together—helping teams identify which customer segments fuel high retention and where intervention is needed.

    Key Takeaways

    • Net revenue retention measures the change in recurring revenue from existing customers, reflecting expansions and losses.
    • An NRR above 100% indicates your current customer base is fueling growth even without new sales.
    • Investors prize NRR for its ability to predict sustainable and capital-efficient growth.
    • Accurate measurement depends on reliable subscription data across billing and CRM systems.
    • Unified platforms like MainFoundry simplify how teams identify and act on the drivers of revenue expansion.

    Improving NRR starts with visibility. Once you can pinpoint where expansions and contractions occur, you can strengthen customer success efforts and product engagement. Ready to unify your CRM, finance, and analytics in one platform? Learn more at MainFoundry.com.