Blog

  • SaaS nøgletal der styrker styring af MRR og churn

    SaaS nøgletal der styrker styring af MRR og churn

    SaaS-nøgletal er selve motoren i enhver abonnementsbaseret forretning. De viser, om du bygger på solide tal eller blot på fornemmelser. I denne guide dykker vi ned i de mest centrale indikatorer for vækst og sundhed i din SaaS-forretning – nemlig MRR, ARR, churn, LTV og CAC. Du får forklaring på deres beregning, hvorfor de betyder noget, og hvordan du omsætter dem til beslutninger, der styrker din virksomheds bundlinje.

    Sådan forstår du MRR, ARR og churn i praksis

    Monthly Recurring Revenue (MRR) er dit fundament – den stabile, forudsigelige månedsomsætning fra aktive abonnementer. Hvis du har 50 kunder, der betaler 1.000 kr. om måneden, er din MRR 50.000 kr. Men de fleste SaaS-forretninger har mange nuancer som rabatter, opgraderinger og churn, hvilket gør det vigtigt at tracke ændringer: ny MRR, expansions-MRR og churned MRR.

    Annual Recurring Revenue (ARR) er ganske enkelt MRR ganget med 12. Det tal bruges især af investorer og bestyrelser, fordi det viser et mere langsigtet billede af forretningen. En MRR på 200.000 kr. svarer til en ARR på 2,4 mio. kr. – men vær opmærksom på, at et voksende ARR ikke nødvendigvis betyder sund vækst, hvis du samtidig mister mange kunder.

    Churn er den stille trussel mod alle SaaS-modeller. Det måler den procentdel af kunder eller omsætning, du mister over tid. En månedlig churn på 5 % kan virke lille, men betyder i praksis, at du skal vokse 5 % hver måned bare for at stå stille. For virksomheder med større kunder er omsætningschurn ofte mere relevant end kundechurn, da én tabt enterprise-kunde kan have enorm effekt.

    “Selv små forbedringer i churn kan have enorm effekt på din vækst, eftersom eksisterende kunder altid er billigere at beholde end nye at vinde.”

    Kobler du dine churn-data med supporthistorik og produktanvendelse, kan du proaktivt reducere churn. Mange virksomheder bruger finansielle dashboards såsom MainFoundry til at samle fakturering, abonnementer og kundedata, så churn og MRR kan følges i realtid uden manuelle regneark.

    Forstå LTV og CAC – og balancen mellem dem

    Lifetime Value (LTV) viser, hvor meget en gennemsnitlig kunde bidrager med over sin levetid. Det handler ikke kun om indtægt, men om fortjeneste. En enkel formel er at tage den gennemsnitlige månedlige omsætning pr. kunde, justere for bruttoavance og dividere med churn-raten. Hvis din gennemsnitskunde bidrager med 750 kr. pr. måned, har 85 % margin og 4 % månedlig churn, bliver LTV cirka 16.000 kr.

    Customer Acquisition Cost (CAC) måler, hvad det koster dig at få én ny kunde – inklusive salarier, marketing og salgsaktiviteter. Hvis du investerer 300.000 kr. og får 30 kunder, er CAC 10.000 kr. Det er først meningsfuldt, når du sammenligner med LTV. En sund SaaS-model har typisk LTV mindst tre gange højere end CAC.

    Derudover er payback-perioden et vigtigt mål: tiden før en kunde har genereret nok bruttoavance til at dække sin CAC. Et godt pejlemærke er under 12 måneder. Hvis det tager 24 måneder, bliver væksten kapitaltung og risikofyldt.

    Pro Tip: Track LTV og CAC i samme dashboard som MRR og churn. Det giver et samlet økonomisk billede og hurtigere beslutningsgrundlag.

    For danske SaaS-teams er Net Revenue Retention (NRR) også et godt supplement. En NRR over 100 % viser, at expansions-salg mere end opvejer churn. Det er et tegn på stærkt product–market fit og sund kobling mellem salgs- og kundesucces.

    Det vigtigste at tage med videre

    • Forstå bevægelsen bag MRR og ARR – de viser kun værdi, når du analyserer drivkræfterne.
    • Churn er en skjult faktor – små fald kan give markant stigning i LTV.
    • Sammenlign altid LTV og CAC for at sikre, at du skalerer rentabelt.
    • Automatisér din rapportering med dashboards som MainFoundry, så beslutninger bygger på opdaterede data frem for mavefornemmelser.
  • MRR Waterfall Guide to Track Subscription Growth

    MRR Waterfall Guide to Track Subscription Growth

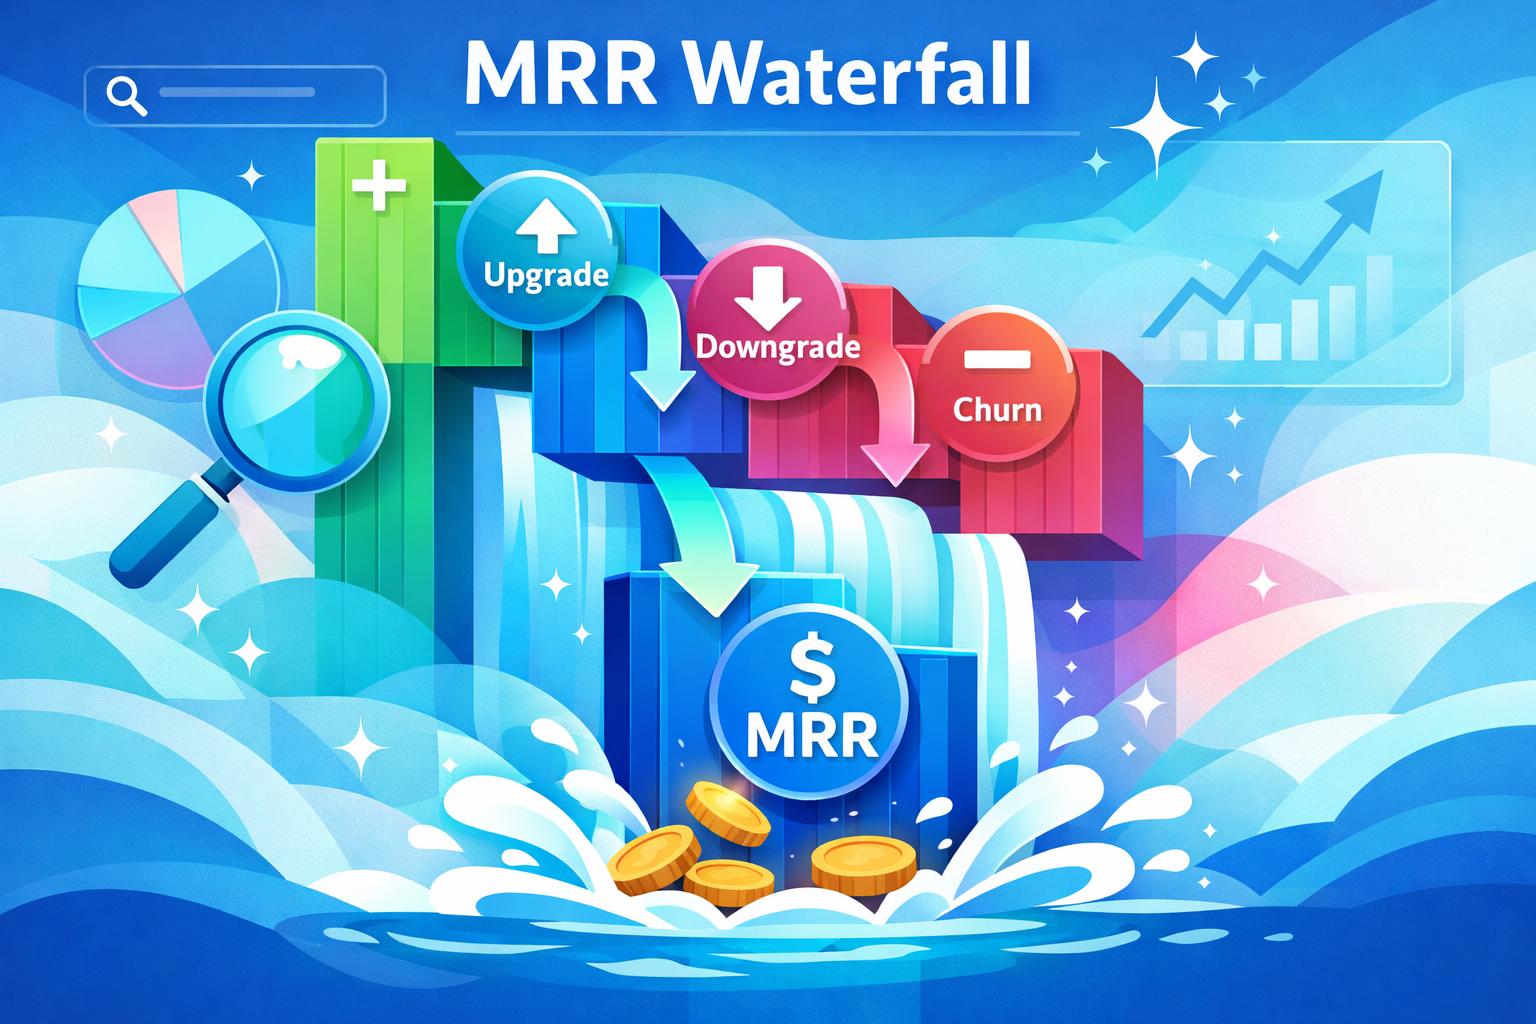
    If you’ve ever looked at your monthly recurring revenue and wondered what’s really driving changes, the MRR waterfall is your roadmap to understanding it. Instead of seeing revenue as a single number, this report breaks down every gain and loss — new subscriptions, upgrades, downgrades, and churn — showing where growth is truly coming from. In this post, you’ll learn how an MRR waterfall works, which components reveal the most about your subscription health, and how to build one you can trust for accurate, actionable insight.

    How the MRR Waterfall Reveals Subscription Dynamics

    At its core, an MRR waterfall shows how your recurring revenue moves from one period to the next by categorizing what’s added, lost, or changed. Starting MRR plus new gains minus losses should equal the closing MRR, giving a clear view of performance drivers. This method highlights which customer actions and behaviors are fueling or slowing growth.

    The standard breakdown typically includes new MRR from new customers, expansion MRR from existing customers upgrading, contraction MRR from downgrades, and churn MRR representing full cancellations. Some businesses also track reactivation MRR to count customers who return after canceling. Together, these categories prevent false optimism by showing whether growth comes from net new revenue or masking steep losses.

    For example, strong new MRR may look good on the surface but could be offset by high churn or contraction. Expansion MRR, on the other hand, is a powerful indicator of product value since it reflects how much existing customers are willing to invest more. Tracking contraction and churn early provides time to address declining engagement before it becomes unrecoverable loss.

    “An accurate MRR waterfall transforms guesswork into clarity by showing not just that revenue changed, but why it changed.”

    When connected to systems like subscription and billing management in MainFoundry, these metrics automatically align with customer and financial data. This allows teams to see MRR changes at both the aggregate and customer levels — turning data from static reports into operational insights.

    Building an MRR Waterfall You Can Trust

    Creating a reliable waterfall starts with clean data. Begin by capturing true monthly recurring revenue snapshots at the start and end of each period. Normalize annual or prepaid contracts into monthly equivalents, and exclude one-time fees to ensure consistency. Once you have those baselines, track every customer-level change precisely by categorizing events correctly — new customer, upgrade, downgrade, or cancellation.

    After categorization, reconcile your data. If starting MRR plus gains minus losses doesn’t equal ending MRR, something is likely missing or misclassified. Common culprits include mid-cycle price adjustments or late updates to cancellations. Visualization is the final and most insightful step, typically using a waterfall chart that visually depicts how each event contributes to the net change in recurring revenue.

    Pro Tip: Tie your MRR data directly to customer accounts in your CRM to identify which accounts are expanding, contracting, or leaving. Platforms like MainFoundry CRM simplify this by linking financial and customer insights in one place.

    When done right, your MRR waterfall becomes more than a finance report — it becomes a growth management tool. Teams can focus conversations around clear levers like reducing churn, improving onboarding for new customers, or promoting expansions through better value realization. For businesses seeking sustainable growth, this level of clarity often matters more than top-line speed alone.

    Key Takeaways

    • An MRR waterfall explains not just how much revenue changed, but why it changed across subscriptions.
    • Expansion and contraction MRR often reveal deeper performance health than new revenue alone.
    • Clean definitions and consistent timing are essential to reconciling MRR accurately.
    • Connecting finance, sales, and customer data inside one system, such as MainFoundry, reduces reporting friction and improves reliability.

    By adopting this structured approach, your revenue tracking goes from reactive reporting to proactive management. Explore how MainFoundry unites subscription analytics and CRM data to make recurring revenue easier to understand and act on, or reach out directly at MainFoundry Contact for tailored guidance.

  • Investor-Ready SaaS Financials Best Practices

    Investor-Ready SaaS Financials Best Practices

    Preparing to meet investors is less about overwhelming them with numbers and more about telling a clear, consistent financial story that proves your SaaS business can scale. In this guide, you’ll learn how to prepare SaaS financials for investors—from standardizing core metrics like MRR and ARR to presenting unit economics that highlight efficiency and sustainability. We’ll also explore how finance tools like MainFoundry simplify investor reporting through centralized data management and consistent reporting.

    Standardizing Metrics for Investor Confidence

    Investor-ready financials start with trust in your definitions. Before anyone dives into your charts, they want to know that your ARR, MRR, churn, and cash figures align with standard SaaS conventions. This means ensuring that GAAP statements—like your profit and loss, balance sheet, and cash flow—are reconciled with SaaS-specific performance metrics. Consistency across reports signals discipline and reliability, two traits every investor values.

    Misaligned definitions can undermine credibility fast. If ARR in a board presentation differs from the ARR in your data room, investors notice. Platforms like MainFoundry’s subscription and billing management keep those definitions uniform by tying revenue, renewals, and upgrades to a single data source. That synchronization ensures that every report tells the same financial truth, minimizing cleanup before important conversations.

    “Consistency is credibility—standardized metrics build the foundation for all investor discussions.”

    With standardized data in place, presentation becomes your competitive edge. Investors care deeply about the story behind your numbers. They want to see where growth originates and how efficient that growth is. That’s where visuals like MRR waterfalls and cohort analyses come in. The MRR waterfall is often an investor favorite because it isolates new business, expansion, and churn with clarity. Paired with trending ARR lines or plan-versus-actual visuals, these charts make your financial story intuitive to read.

    Cohort analysis digs deeper into retention quality. By grouping customers based on start date or segment and tracking revenue over time, you demonstrate whether your retention rate strengthens as your product evolves. Investors are quick to recognize stable or expanding cohorts as signs of product-market fit. Maintaining at least two years of cohort data also accelerates due diligence during later fundraising rounds.

    Pro Tip: Automate recurring metrics like ARR or churn directly within your finance platform to eliminate discrepancies and boost investor confidence in your reporting.

    Turning SaaS Unit Economics into a Clear Narrative

    After establishing metrics, shift the focus from growth to efficiency. Every investor wants to know whether each growth dollar generates sustainable returns. That’s where unit economics—such as CAC, LTV, and payback period—come into play. These metrics reveal how effectively your business transforms capital into durable, recurring revenue. Early-stage investors prioritize the LTV-to-CAC ratio, while growth-stage backers focus on improving payback timelines and retention strength over time.

    Your investor materials should present these efficiency stories through trends and management insights, not raw data tables. For example, showing that LTV is widening while CAC remains stable builds a persuasive efficiency narrative. When supported with visuals and contextual commentary, the message resonates without overwhelming. That same consistency should be mirrored in monthly updates and board decks to create a steady investor cadence long before fundraising begins.

    • Monthly metric updates with brief commentary aligning financial and operational performance
    • Board materials that highlight trends, not just static numbers
    • Continuously updated data rooms that house financials, cohorts, and assumptions

    Platforms like MainFoundry simplify this process by connecting subscriptions, invoices, and revenue analytics in one unified system. That integration drastically reduces manual reconciliation while giving founders the clarity needed to explain what’s really driving their metrics—growing revenue, improving retention, or expanding customer lifetime value.

    Key Takeaways

    Building investor-ready SaaS financials comes down to clarity, consistency, and credibility. Standardize your metrics so every report tells the same story, use visuals like MRR waterfalls and cohort analyses to simplify your growth explanation, and ensure your unit economics highlight efficiency and sustainability. The right financial narrative isn’t about complexity—it’s about confidence. To streamline your preparation, explore how MainFoundry supports SaaS teams with unified financial reporting and data consistency. For more guidance, visit MainFoundry’s contact page or browse additional investor-readiness resources.

  • Gross Margin SaaS Benchmarks, COGS, and Valuation

    Gross Margin SaaS Benchmarks, COGS, and Valuation

    If you operate or invest in a SaaS business, understanding gross margin SaaS performance is one of the fastest ways to assess scalability and efficiency. SaaS companies can deliver software repeatedly at low incremental cost, making margins a vital reflection of sustainability. This post unpacks what gross margin really means for SaaS, how to define cost of goods sold (COGS), what typical benchmarks look like, and why small margin shifts can dramatically affect valuation and investor confidence. You’ll also discover how better expense categorization can turn gross margin into a forward-looking management tool rather than a retroactive metric.

    What Gross Margin Means for SaaS Companies

    At its core, gross margin reveals how efficiently a SaaS company delivers its product to customers. The calculation is simple—revenue minus cost of goods sold, divided by revenue—but the meaning depends entirely on what’s included in those costs. For SaaS, gross margin focuses on direct, recurring costs required to deliver the service, excluding broader operating expenses like marketing, R&D, or administrative salaries.

    This distinction helps teams see if the product itself is profitable before layering in growth investments. A healthy margin implies sufficient room to fund innovation and acquisition, while a thin margin can undermine even fast top-line growth. Consistency in how you define and track costs becomes essential to interpreting the story your data tells.

    “A strong SaaS gross margin shows the product engine is efficient and scalable long before sales or marketing investments come into play.”

    Common COGS components include hosting and infrastructure costs such as cloud compute and storage, customer support for existing users, onboarding or implementation services, and any third-party licenses directly tied to software delivery. In contrast, product development or sales-related spend should remain outside COGS to maintain clarity and accuracy. Using consistent definitions turns gross margin from a fuzzy number into a reliable management gauge. Platforms like MainFoundry make this easier by enabling precise categorization between revenue, hosting, and customer support expenses.

    Gross Margin Benchmarks and Valuation Impact

    SaaS businesses are prized for their strong margins, especially as they scale. Once the product is built, serving additional customers costs little, which is what makes the model so powerful. Industry-wide, gross margins between 70 and 85 percent are generally considered healthy, with mature or enterprise-focused companies often surpassing 80 percent. Early-stage SaaS may temporarily sit below this range as onboarding and infrastructure investments scale, but improving over time signals operational strength.

    From an investor’s perspective, gross margin drives confidence in scalability. High-margin SaaS models can self-fund growth, making them appealing during fundraising or acquisition. Conversely, low margins increase risk, implying that delivering the product consumes too much revenue. Investors must then question pricing, cost structure, or long-term profitability. Tracking margin trends monthly—or through trailing averages—helps reveal progress and risks early.

    SaaS companies with gross margins above 80% often command premium valuations because they scale faster with less incremental cost.

    Operational leaders should treat gross margin as more than a snapshot metric. When margins expand, it validates efficiency improvements such as automation or better onboarding. When they compress, it’s a sign to review pricing, vendor contracts, or support processes. Tools like MainFoundry’s connected CRM and billing environment simplify this by tying revenue, customer segments, and expense data together. That visibility helps identify which cohorts or plans drive the healthiest economics.

    Key Takeaways

    • Gross margin measures delivery efficiency by isolating revenue minus direct product costs, not overall profitability.
    • SaaS COGS should include only customer-scaling costs such as hosting, support, and onboarding—not R&D or marketing spend.
    • Healthy benchmarks range between 70% and 85%, with industry leaders often exceeding 80% as they mature.
    • Because investors tie gross margin directly to valuation, maintaining strong margins signals resilience and efficiency.
    • Unified financial and CRM platforms bring visibility, turning gross margin into a tool for proactive decision-making.

    Related Reading

    Explore SaaS Valuation Metrics: ARR, Retention, and Efficiency Ratios to learn more about how investors evaluate SaaS performance.

  • SaaS Finance Dashboard Real-Time Metrics Without Spreadsheets

    SaaS Finance Dashboard Real-Time Metrics Without Spreadsheets

    If you’re running a SaaS business, your financial data moves fast—new signups, churn, upgrades, and expenses all shift in real time. A SaaS finance dashboard helps you make sense of that constant motion without waiting for end-of-month reports or juggling untrustworthy spreadsheets. In this post, we’ll explain what a modern finance dashboard should include, why spreadsheets and basic BI tools fall short, and how integrated platforms like MainFoundry deliver live MRR, ARR, and expense insights for faster, data-driven decisions.

    What a Modern SaaS Finance Dashboard Should Show

    A finance dashboard is only as good as its data freshness. Traditional spreadsheets and static reports may look organized, but they hide timing issues and outdated inputs. A modern SaaS finance dashboard must present live, connected data flowing directly from billing, CRM, and operational sources.

    At its core, this kind of dashboard delivers instant visibility into recurring revenue. Real-time MRR and ARR calculations automatically adjust as customers upgrade, downgrade, or churn, giving leaders true cash flow clarity. When tied into customer records within a unified CRM system like MainFoundry’s unified CRM and finance platform, revenue insights stay grounded in actual customer behavior rather than abstract trends.

    Beyond simple totals, you also need clarity around *where* revenue comes from and *how* it changes over time. Segmenting results by plan, cohort, or customer type reveals growth dynamics, helping you pinpoint promising segments or emerging risks. When linked with marketing analytics and attribution, these insights turn into actionable strategies instead of just metrics.

    Equally essential is churn analysis. A live dashboard should constantly monitor retention, renewals, and churn—far before renewal periods—so teams can identify problems proactively. Linking churn data to CRM activities or onboarding histories highlights patterns early and quantifies the ARR impact before issues escalate.

    Modern dashboards also unify expense tracking and burn rate monitoring. In platforms like MainFoundry’s subscription and billing management environment, expenses, invoices, and receivables appear side by side. This single view highlights rising costs, provides real cash flow context, and ensures burn rate updates with every payment or revenue shift—yielding an accurate real-time runway assessment.

    “A real-time SaaS finance dashboard transforms finance from a reporting function into a fast-moving operational driver.”

    Why SaaS Teams Move Beyond Spreadsheets and BI Tools

    Familiar as they may be, spreadsheets create friction. They demand manual updates, carry risk from fragile formulas, and rarely sync perfectly across systems. Even the best-designed spreadsheet dashboard is outdated within hours. Similarly, standalone BI tools visualize data nicely but still depend on disconnected sources and constant upkeep.

    A truly effective SaaS finance dashboard lives within the same system that powers subscriptions, billing, and CRM. This is where MainFoundry stands out—by combining core financial and operational data into one connected platform. Data flows automatically from every billing event or invoice update, forming a single version of financial truth instead of many inconsistent reports.

    Customization also matters. Executives might focus on ARR and burn rate, while finance teams zero in on cash flow or expense patterns. With custom workspaces for finance and operations, dashboards adapt to these roles without splitting data sources or compromising accuracy.

    Automation and AI-driven finance insights now redefine how teams work with data. Instead of manually pulling or merging reports, AI systems like MainFoundry’s AI platform can surface patterns—such as growing churn or rising burn rates—before they become serious issues. These capabilities free teams to focus on strategy rather than spreadsheet maintenance.

    Pro Tip: Build dashboards inside the same tools that power your revenue and billing operations. This ensures your financial metrics always reflect reality—not last week’s exports.

    Key Takeaways

    • A modern SaaS finance dashboard delivers real-time MRR, ARR, churn, and expense tracking linked directly to operational systems.
    • Integrating finance and CRM data transforms reporting into a proactive growth tool rather than a backwards-looking summary.
    • Spreadsheets and legacy BI tools lag behind—automation and integration offer speed, trust, and precision.
    • Platforms like MainFoundry unite billing, CRM, and financial data into one real-time source of truth for faster decision-making.

    Next Steps

    If your reporting still depends on exports and manual reconciliation, it’s time for a change. Explore MainFoundry to see how connected finance, CRM, and analytics can deliver clarity without complexity.

  • SaaS Financial Reporting Mistakes That Hurt Growth

    SaaS Financial Reporting Mistakes That Hurt Growth

    Financial reporting failures in SaaS don’t happen overnight—they grow quietly in spreadsheets and inconsistent data as startups chase speed over structure. Before long, what looked “good enough” becomes a liability. This post explores why SaaS companies fail at financial reporting, highlighting the early missteps that distort performance and create turbulence during growth. You’ll learn how small accounting inconsistencies lead to big problems, and how structured systems help SaaS teams build reporting that scales with clarity and confidence.

    The hidden setup: why SaaS financial reporting goes wrong early

    In the early stages of a SaaS business, financial hygiene often takes a back seat to growth. Founders prioritize launching features and signing customers, assuming they can “clean up the books” later. But SaaS financials are unique—subscription revenue, deferred income, renewals, upgrades, and lifetime value must be tracked systematically for decisions to be sound. When these details aren’t managed consistently, founders end up steering with distorted data, and investors quickly lose confidence.

    Most financial reporting breakdowns stem from recurring mistakes: blending cash and accrual accounting, mishandling deferred revenue, and misclassifying expenses. Each alone might seem manageable, but together they create statements no one fully trusts. When deferred revenue is recognized too early, growth looks inflated and churn invisible—until sudden revenue drops expose the truth. Inconsistency between subscription data, billing tools, and financials compounds the confusion and makes audits painful.

    “SaaS reporting failures rarely come from complexity—they come from inconsistency.”

    Building structured systems that scale with your SaaS

    Preventing future reporting chaos starts with consistent accrual-based accounting. Each contract should follow the same revenue recognition logic, updating automatically as customers renew or upgrade. Deferred revenue schedules must be tied to actual service delivery—not cash in the bank. This ensures your financial statements keep their internal logic even as transaction volume grows and business models evolve.

    Equally critical is aligning operational metrics like MRR, ARR, churn, and expansion revenue with your financial system. Many SaaS teams track these metrics in isolated dashboards, disconnected from accounting data. When both metrics and financials pull from the same structured foundation, you gain a single version of truth. Platforms such as MainFoundry’s finance management tools make this integration seamless, ensuring deferred revenue and invoicing remain in sync from the start.

    A clean chart of accounts and department-level expense tracking are equally important for clarity. They make metrics like gross margin and burn rate instantly visible, not buried in manual reports. With custom workspaces and flexible data models, teams can connect financial and operational insights without rigid templates. And by linking CRM and finance data directly through MainFoundry’s unified CRM integration, you can finally connect revenue to customers, contracts, and lifecycle stages—all in one consistent system.

    Pro Tip: Invest in connected financial infrastructure early—fixing reporting when it breaks later costs exponentially more than building it right from day one.

    Key Takeaways

    • SaaS reporting issues begin early, caused by unstructured data and mixed accounting methods.
    • Deferred revenue mismanagement inflates short-term performance while hiding churn and risk.
    • Consistent accrual accounting and integrated systems create reliable, scalable financial visibility.
    • Platforms like MainFoundry align subscriptions, billing, and CRM data to maintain a single source of truth.
    • If your reports feel fragile, revisit your foundation—accuracy and consistency are the ultimate growth assets.

    Related Reading

    Discover how modern SaaS firms automate revenue recognition in MainFoundry’s billing and subscription insights.

  • SaaS Metrics Benchmarks 2026 for Every Growth Stage

    SaaS Metrics Benchmarks 2026 for Every Growth Stage

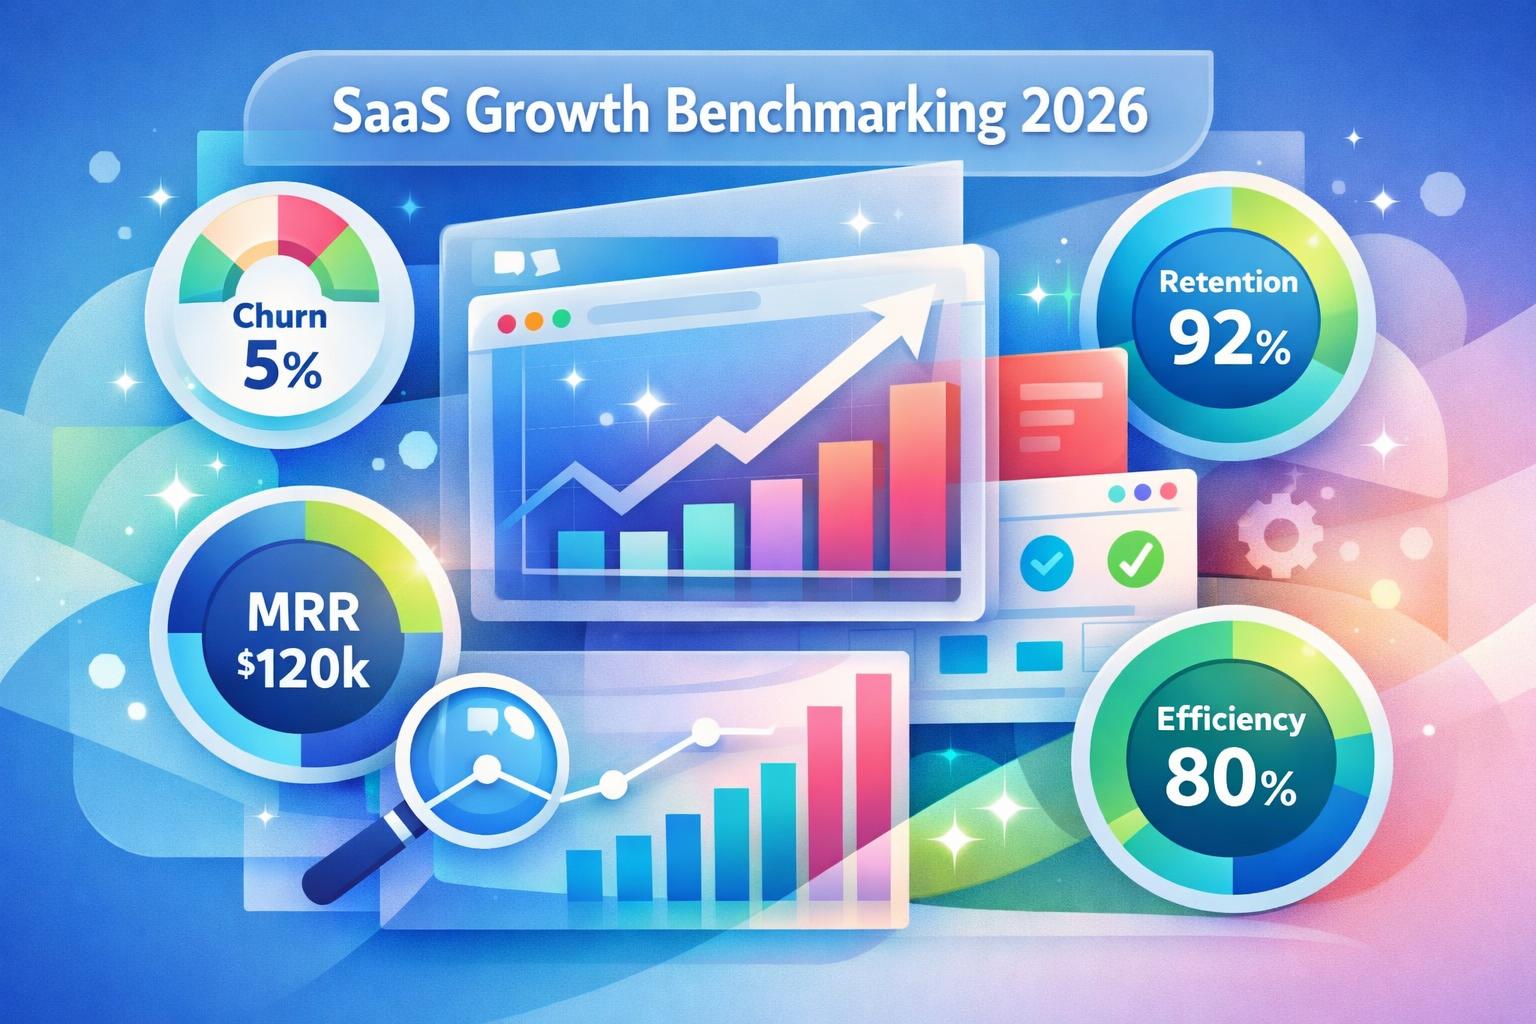
    If you’re scaling a SaaS company in 2026, you’ve likely realized that today’s performance standards look very different from the hypergrowth era of years past. The landscape has matured, capital efficiency matters more than ever, and investors want to see sustainable growth rather than short-term spikes. This post unpacks the latest SaaS metrics benchmarks 2026—covering MRR growth, churn, retention, LTV:CAC, and margins—organized by company stage. You’ll learn what healthy performance looks like now, how to diagnose red flags early, and how unified finance tools like MainFoundry help founders stay ahead of the curve.

    How SaaS Benchmarks Shift by Stage

    In 2026, SaaS growth has normalized into a world where sustainability beats spectacle. Between $1M and $30M in ARR, most companies grow around 25% annually, while top performers hit 40–50%. The wild years of universal 60%+ expansion are behind us. For seed startups, uneven growth is typical—stability and validation matter more than flashy percentages. Series A businesses aim to prove repeatable demand, while Series B+ companies increasingly drive expansion from existing customers rather than constant acquisition.

    Accurate tracking means understanding where growth originates—new customers, upgrades, or reactivations—and how durable it is. With MainFoundry’s subscription and billing management, founders gain clarity on revenue composition, identifying which streams are repeatable versus one-offs. This stage-by-stage transparency turns raw MRR growth into actionable insight.

    “In 2026, durability—not velocity—is the ultimate growth benchmark for SaaS companies.”

    Similarly, churn continues to constrain true scale. A monthly churn below 1% (roughly 5% annually) still defines healthy retention, while top-tier B2B players push even lower. Early-stage founders often miss the warning signs because small sample sizes can disguise weaknesses in onboarding or product stickiness. By Series A, retention becomes a credibility test—strong unit economics start with customers who stay. Platforms like MainFoundry’s integrated CRM and finance tools connect churn data to deal metrics, illuminating the “why” behind every lost account.

    Retention, Efficiency, and the Economics of Growth

    Across modern B2B SaaS, net revenue retention (NRR) just above 100% is now the median benchmark. The best-performing companies exceed 120%, driven by usage-based expansion and upsells. While seed-stage businesses often hover near break-even retention, Series A teams cross 105% as they find product-market fit and pricing discipline. At Series B+, anything below 110% can trigger investor concern about scalability and expansion efficiency.

    Strong retention compounds growth. Companies with healthy NRR can grow faster on the same marketing spend, making it more important than raw customer count. With MainFoundry’s real-time revenue metrics, founders monitor retention continuously instead of waiting for board decks to reveal surprises.

    Pro Tip: Review NRR and MRR growth together—high retention can mask slowing acquisition, while high growth can hide churn risk. Assess both side by side for a complete efficiency picture.

    The LTV:CAC ratio remains a litmus test for lasting profitability. A minimum of 3:1 is standard, while 4:1 indicates elite operational health. Early-stage calculations often mislead due to variable sales inputs, but by Series A and beyond, accurate CAC measurement—and roughly one-year payback periods—signal maturity. MainFoundry’s unified finance management tools ensure founders ground these ratios in verifiable data rather than optimistic projections.

    Finally, gross margin remains the stabilizing force beneath every metric. In 2026, top SaaS companies still record margins in the high‑70% to mid‑80% range, with improvements yielding direct gains in valuation. Sub‑70% margins often reveal structural inefficiencies—overreliance on services, infrastructure waste, or fragmented systems. MainFoundry’s unified cost attribution helps teams pinpoint exactly where margin improvement efforts should focus.

    Companies with NRR above 110% reduce their pressure on acquisition and grow nearly twice as fast over time.

    Key Takeaways

    • In 2026, efficient growth has replaced hypergrowth as the defining SaaS objective.
    • Median growth sits around 25%, with churn below 1% and NRR over 110% key to resilience.
    • Healthy LTV:CAC ratios (3:1 or higher) and margins above 75% remain cornerstones of scalable profitability.
    • Visibility across revenue, churn, and cost data enables proactive decisions before inefficiencies compound.
    • Founders can streamline benchmarking with unified tools like MainFoundry, turning financial insight into action.

    Related Reading

    Explore our deep-dive on SaaS billing efficiency to understand how integrated revenue systems can further improve your metric accuracy.

  • How to Reduce SaaS Churn With CRM-Driven Signals

    How to Reduce SaaS Churn With CRM-Driven Signals

    Reducing churn is one of those persistent challenges every SaaS team faces but few truly master. When growth slows or cancellations outweigh expansions, it’s often a sign that disengagement has begun. This practical guide breaks down a data-driven approach to lowering SaaS churn by identifying risk early, improving onboarding, building reliable health scores, and streamlining payment recovery. You’ll learn how connected systems can help your team act before customers walk away—and how platforms like MainFoundry make proactive retention the standard, not the exception.

    Identify Churn Risk Before It’s Too Late

    Most churn doesn’t happen suddenly—it builds quietly as signals accumulate. Customers use fewer features, log in less often, or let billing warnings slip by. The challenge for SaaS teams is connecting these dots early enough to make a difference. When usage data, billing alerts, and communications live in separate tools, these patterns remain invisible until it’s too late.

    To catch churn risk early, look for behavioral shifts rather than formal cancellations. For instance, a sharp drop in login frequency or feature adoption signals unmet expectations. When CRM data and engagement tracking are unified, subtle trends become obvious—like a once-active account that suddenly goes silent for two weeks. This context empowers your success team to respond before frustration sets in.

    Platforms such as MainFoundry enable these insights by linking every customer interaction—emails, meetings, activity, and billing—within one timeline. Instead of pulling fragmented reports, teams can visualize how engagement evolves across accounts. From there, building effective customer health scores transforms patterns into practical action. A missed payment paired with declining usage becomes a clear signal to step in, rather than two isolated data points lost across systems.

    “Early visibility changes the tone of customer conversations—from reactive damage control to proactive partnership.”

    Build a Churn Reduction System That Scales

    Once you can spot warning signs early, the next step is acting systematically. A strong churn prevention framework combines three engines: onboarding, health scoring, and payment management. Each supports retention from first login to renewal, reinforcing customer confidence at every stage.

    Successful onboarding delivers value fast. Instead of showcasing every feature, drive customers toward one activation milestone—their first “aha” moment. Monitor progress over the initial weeks. If users stall, proactively offer guidance or walkthroughs to remove friction. Feedback during this phase often exposes fixable issues that cause long-term churn if ignored.

    Customer health scores extend this mindset through the entire lifecycle. A dynamic score reflecting usage depth, support history, and billing reliability gives teams a clear prioritization map. With MainFoundry’s custom workspaces, you can design workflows that trigger alerts or tasks when health dips—turning metrics into real-time action.

    Pro Tip: Automate outreach when a combination of low usage and billing alerts appear—these blended signals predict churn far more accurately than isolated metrics.

    Then there’s involuntary churn—accounts lost to expired credit cards or failed transactions. Even the best success strategy falters if payment recovery is ignored. Smart billing flows that provide gentle reminders, retry logic, or subscription pause options can reclaim significant revenue while keeping relationships intact. When subscription management and CRM data connect, outreach becomes informed and empathetic instead of transactional.

    • Define one activation milestone and track progress during onboarding
    • Build dynamic health scores with real data like usage and billing stability
    • Automate tasks or messaging when risk signals trigger
    • Recover failed payments through customer-friendly workflows

    Key Takeaways

    Reducing churn hinges on visibility and connected data. Teams that effectively tackle how to reduce SaaS churn don’t rely on last-minute interventions—they detect problems before they grow. Focus first on understanding where customer signals live and begin unifying them. Treat onboarding as the foundation of retention, use health scores to guide structured outreach, and protect your bottom line through smart payment recovery.

    If your team is ready for a unified approach, MainFoundry offers one workspace for CRM, engagement data, and billing visibility. That connected ecosystem doesn’t just prevent churn—it builds trust through timely, context-driven action. Start by reviewing where your data is fragmented, then connect the dots that matter most. Sustainable retention begins with clarity and consistency.

    Related Reading

    Explore How to Create Effective SaaS Health Scores for deeper insights into risk prediction models.

  • SaaS Financial Dashboard Metrics That Drive Decisions

    SaaS Financial Dashboard Metrics That Drive Decisions

    A strong SaaS financial dashboard isn’t just a spreadsheet turned visual—it’s your daily compass for understanding growth, efficiency, and risk. Too often, these dashboards overwhelm rather than inform, leaving founders scrambling for clarity. This guide shows you how to build a SaaS financial dashboard that actually scales, supports real decisions, and stays trusted over time. You’ll learn which key metrics matter most, how to visualize them effectively, and how to keep your data fresh without manual effort.

    Designing a SaaS Financial Dashboard That Drives Real Decisions

    When most teams attempt to build dashboards, they fall into a familiar trap—displaying every chart imaginable. The result is a beautiful but useless dashboard that no one checks. Many fail because metrics are old, figures don’t align with accounting, or users simply don’t trust what they see. In SaaS, where **recurring revenue**, churn, and **customer acquisition costs** behave differently from one-time sales metrics, clarity is everything.

    To build something teams actually use, start with a small, reliable set of indicators anchored in consistent data. Focus on questions decision-makers care about: Are we growing? Is that growth sustainable? Can current cash support our next stage? By narrowing metrics down to the essentials and pulling data from connected sources, your dashboard becomes actionable rather than ornamental.

    “A useful SaaS dashboard doesn’t track everything—it tracks what drives decisions.”

    Integrated systems make this discipline feasible. When your revenue lives in one tool, expenses in another, and subscriptions in a third, reconciling core metrics like LTV or CAC becomes slow and error-prone. Tools such as MainFoundry solve this by natively connecting billing, revenue metrics, and expense tracking into a unified financial view. Their finance management dashboard keeps metrics consistent and instantly usable across teams.

    The Metrics and Visual Practices That Make Dashboards Work

    The foundation of your dashboard should be clear, comparable metrics that define financial health. The most valuable ones—such as **Monthly Recurring Revenue (MRR)**, **Churn rate**, **Lifetime Value (LTV)**, **Customer Acquisition Cost (CAC)**, and **Runway**—offer signal rather than noise. Around these, you can include supporting context like ARR, average revenue per account, operating expenses, and cash flow. The fewer, the better.

    • Focus on five to seven key performance indicators that reflect both growth and sustainability.
    • Ensure data consistency by syncing metrics directly from your billing, CRM, and accounting systems.
    • Visualize trends with line charts and comparisons with clear, unobtrusive color schemes.

    Visualization should be about comprehension, not decoration. Time-based charts like MRR trends or churn should use simple line graphs, while comparisons such as LTV vs. CAC are easier to digest through clean bar formats. Minimalism wins—dashboards loaded with filters and dense colors slow reactions. MainFoundry’s custom workspaces add flexibility by tying financial entries to customers or projects, maintaining context without clutter.

    Pro Tip: Match update cadence to data volatility—cash and revenue may update daily, while LTV and CAC often work best on a weekly or monthly basis.

    Avoid manual refreshes whenever possible. Automation through direct integrations keeps dashboards accurate and timely. For instance, MainFoundry syncs CRM, marketing attribution (/marketing/), and financial data so decision-makers always see the latest metrics without extra work.

    Key Takeaways

    Building a scalable SaaS financial dashboard is about focus and trust. Start with metrics that genuinely reflect performance—MRR, churn, LTV, CAC, and runway—and map them to authoritative data sources. Keep your visuals simple enough to scan in minutes and automate updates so accuracy never depends on manual effort. Finally, revisit your dashboard quarterly to realign it with evolving business goals and stages of growth. For teams seeking an integrated approach, MainFoundry unites finance, CRM, and analytics into one cohesive platform—helping your dashboard grow as your business scales.

    Related Reading

    Explore how AI-driven financial insights can further streamline your SaaS decision-making.

  • How to Calculate SaaS CAC Using CRM Data

    How to Calculate SaaS CAC Using CRM Data

    Understanding how to calculate CAC for SaaS accurately can make or break your growth strategy. This metric reveals what you truly spend to win each new customer and determines whether your acquisition efforts are sustainable in the long run. In this guide, you’ll learn the correct step-by-step approach, when to use blended versus channel-specific CAC, and how to benchmark effectively for different business stages. You’ll also discover how platforms like MainFoundry unify your data to make CAC a truly operational metric instead of just a spreadsheet number.

    How to Calculate CAC for SaaS the Right Way

    At its core, customer acquisition cost (CAC) represents the average expense of acquiring one paying customer over a given time frame. Although the formula is simple, the preparation behind it matters. Before calculating, select a time period that accurately reflects your sales cycle. If conversions take several months, align today’s customer numbers with your prior marketing and sales expenditure for realistic results.

    Once you’ve chosen the right timeframe, gather every cost connected to acquisition—paid ads, campaign budgets, team salaries, commissions, software subscriptions, and consultant fees. Avoid mixing unrelated expenses like product development or support for existing clients. When you have the total acquisition cost and the count of new paying customers, dividing one by the other yields your CAC. For instance, if you spent $20,000 and acquired 50 new users, your CAC equals $400.

    “Accurate CAC depends on complete, connected data across marketing spend, sales activity, and customer acquisition records.”

    Many teams struggle with fragmented systems—marketing spends tracked separately from sales or customer data. A unified CRM and marketing platform like MainFoundry solves this by connecting campaign performance, conversion tracking, and closed deals, letting you calculate CAC with true precision.

    Blended vs. Channel-Specific CAC: Choosing the Right Approach

    Once you can compute overall CAC, decide which version helps most with your analysis. Blended CAC consolidates all acquisition costs into one figure, offering a broad efficiency snapshot perfect for investor reports or financial planning. However, it masks individual channel performance—strong organic results might conceal underperforming paid campaigns.

    In contrast, channel-specific CAC breaks down spending by sources like paid search, content marketing, or outbound sales. With this view, teams identify which channels deliver customers most efficiently and refine budgets accordingly. Reliable channel-level CAC hinges on accurate attribution—tracking each campaign through UTM data, lead conversion, and revenue outcomes. Marketing attribution tools within MainFoundry link campaigns to actual customer revenue, replacing guesswork with clarity.

    A healthy SaaS business targets an LTV-to-CAC ratio of at least 3:1—efficient growth hinges on maintaining that balance.

    Keep in mind that CAC benchmarks differ across SaaS stages. Early ventures may experience higher costs while experimenting with acquisition tactics. Mature businesses improve ratios as their brand recognition grows. Instead of chasing an arbitrary number, track trends—monitor whether CAC falls as performance improves or rises due to inefficient channels.

    Key Takeaways

    • CAC is straightforward to calculate but only meaningful with clean, connected data.
    • Align your measurement period with actual conversion timelines for accuracy.
    • Use blended CAC for executives and channel-specific CAC for optimization decisions.
    • Track your LTV-to-CAC ratio and watch trends rather than isolated metrics.
    • Integrating marketing, CRM, and financial data—such as with MainFoundry—turns CAC into an actionable metric across your entire SaaS operation.

    Related Reading

    Check out Understanding LTV for SaaS Growth for deeper insight into balancing acquisition costs with customer lifetime value.